What’s New in R: September 22, 2025
Welcome to this week’s edition of What’s New in R! This week, we’ve got three videos featuring a tutorial on extracting data from PDFs using AI, a recreation of a New York Times chart, and an overview of the new Positron IDE. Let’s dive in!
How to Turn Messy PDFs into Clean Data Frames with R and Elmer

Albert Rapp demonstrates how to use the {ellmer} package to leverage AI models for extracting data from messy PDF files. If you’ve ever struggled with getting clean data out of PDFs, you know how challenging this task can be. This tutorial shows how AI can streamline this traditionally painful process, making it much easier to transform unstructured PDF content into usable data frames in R.
Copy the Pros: How to Recreate this NY Times Chart in R
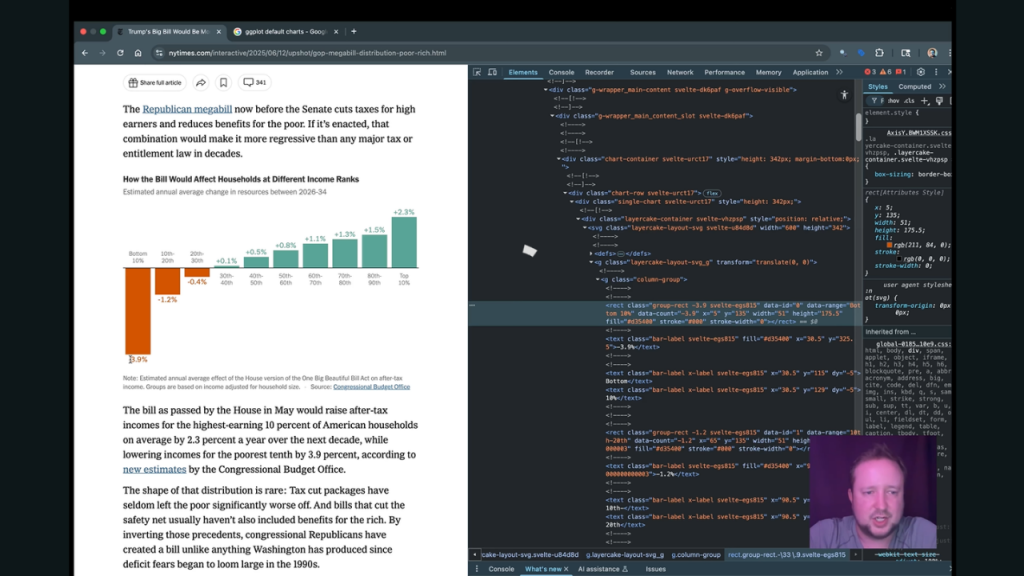
Spencer Schien walks through the process of recreating a professional New York Times chart using R. This type of tutorial is invaluable for learning advanced data visualization techniques by studying and replicating the work of professional data journalists with ggplot.
A First Look at Positron
Julia Silge provides a comprehensive overview of Positron, the next-generation data science IDE built by the creators of RStudio. Presented at the recent useR! conference, this video gives you everything you need to know about Positron’s features and capabilities. If you’re considering making the switch from RStudio to Positron, this is an excellent resource to help inform your decision.
If you enjoyed this issue of What’s New In R, please share it with a friend! And if they want to get What’s New in R directly in their inbox, they can sign up on the R for the Rest of Us website.
Got any ideas for resources I should feature in future issues of What’s New in R? Leave a comment below!
Sign up for the newsletter
Get blog posts like this delivered straight to your inbox.

You need to be signed-in to comment on this post. Login.