What’s New in R: January 20, 2026
Welcome to this week’s edition of What’s New in R! This week, we’re featuring an AI-assisted dashboard development workflow, a tutorial on burst reporting with Quarto and Typst, and a guide to creating custom GPS route maps. Let’s dive in!
Building a Clinical Dashboard Prototype in 2 Days: An AI-Assisted Development Workflow

Dario Radečić from Appsilon demonstrates how AI tools can dramatically accelerate dashboard prototyping, turning what typically takes 4-6 weeks into a 48-hour sprint. Rather than relying on a single AI assistant, the team used six tools in parallel—including Claude Code, V0.dev, and Google AI Studio—combining their respective strengths to build a functional PK/PD simulation dashboard. The article provides an honest assessment of what AI tools excel at (UI generation, standard components, and rapid iteration) versus what still requires human expertise (architecture decisions, compliance requirements, and code quality). This is a practical look at AI-assisted development that goes beyond the hype.
Burst Reporting On A Budget
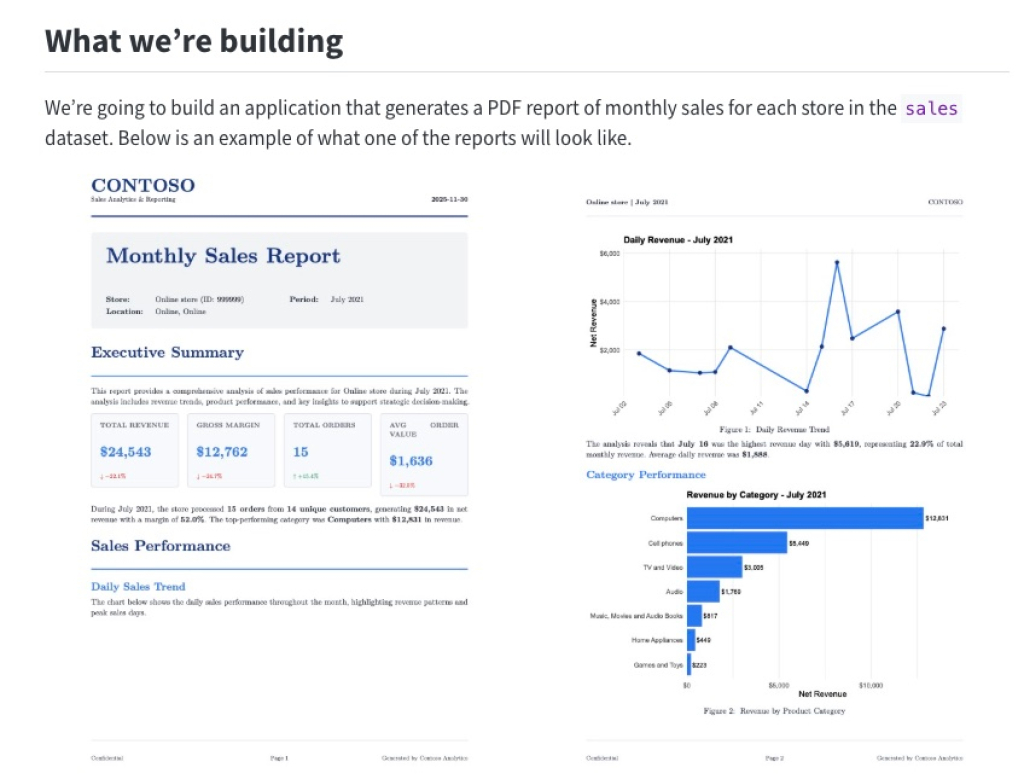
In this blog post, Joe Kirincic uses Quarto, Typst, and the {contoso} package to create a system that generates customized monthly sales reports for each store in a dataset. The tutorial covers creating Typst templates with custom functions, building parameterized Quarto documents, and implementing burst reporting functionality in R. As a bonus, he shows how to use the {mirai} package to parallelize report generation, achieving a 4.5x performance improvement by utilizing multiple CPU cores.
Create custom GPS route maps in R
Nicola Rennie provides a comprehensive guide to creating custom GPS route maps that you can print and hang on your wall. The tutorial demonstrates how to work with .gpx files from GPS watches or race websites, process the spatial data using {sf}, and add contextual background maps using OpenStreetMap data via the {osmdata} package. Rennie covers important spatial data concepts like coordinate reference systems, bounding boxes, and buffering, while also sharing practical tips for styling maps with custom fonts and colors. Whether you’re documenting your own running routes or learning about spatial data visualization in R, this post offers valuable insights into working with geospatial data.
If you enjoyed this issue of What’s New In R, please share it with a friend! And if they want to get What’s New in R directly in their inbox, they can sign up on the R for the Rest of Us website.
Got any ideas for resources I should feature in future issues of What’s New in R? Leave a comment below!
Sign up for the newsletter
Get blog posts like this delivered straight to your inbox.

You need to be signed-in to comment on this post. Login.