
What’s New in R: March 2, 2026
Welcome to this week’s edition of What’s New in R! This week, we’re featuring a tutorial on visualizing biking data with elevation profiles, a package for simulating live typing in demos, and a guide to creating travel-time matrices for spatial analysis. Let’s dive in!
Getting Over It
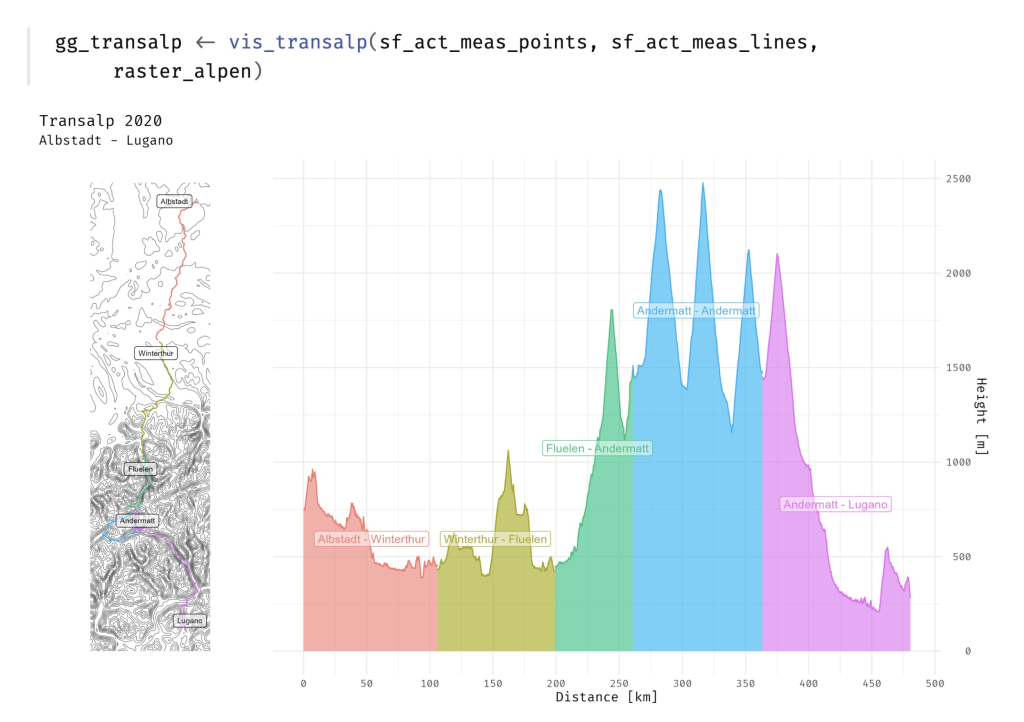
Julian During visualizes his 2020 Transalp bike ride across the Alps using GPS data from Strava. The tutorial demonstrates how to use the {sf} package to work with spatial data, {elevatr} to add elevation information, and {ggplot2} combined with {patchwork} to create both a map showing the route and an altitude profile showing the enormous elevation gains. The altitude profile is particularly striking, revealing the challenge of the ride through the cumulative elevation changes. During’s approach shows how to combine multiple spatial data sources to tell a compelling data story about a personal achievement.
Announcing {typeR}: simulate live typing of R scripts
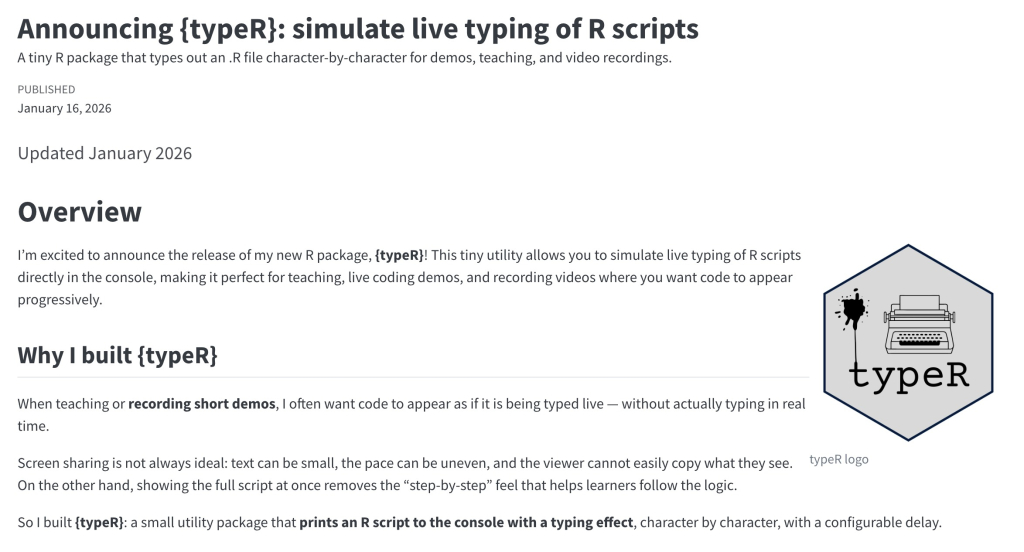
Federica Gazzelloni introduces {typeR}, a lightweight package for simulating live typing of R scripts character-by-character in the console. The package is designed for teaching and recording demos where you want code to appear progressively without actually typing in real time, solving the problem of screen sharing where text can be too small or pacing uneven. By simply providing a path to an R script file, typeR() prints the code with configurable delays between characters and automatically executes each line. It’s a simple tool that fills a specific need for educators and anyone creating R tutorials or demonstrations.
Travel-time cost matrices
Kyle Walker demonstrates how to create realistic facility location analyses by using actual travel times instead of straight-line distances. The vignette shows how to use the {r5r} package with OpenStreetMap data to generate travel-time matrices, then integrate them with the {spopt} package for facility location problems. Walker compares solutions using Euclidean distance versus real drive times for placing facilities in Tarrant County, Texas, showing how the travel-time approach accounts for highway access and road networks rather than forming simple circular service areas. While this is a niche application in geospatial analysis, it’s essential for problems like emergency service placement where actual travel times significantly impact decisions.
If you enjoyed this issue of What’s New In R, please share it with a friend! And if they want to get What’s New in R directly in their inbox, they can sign up on the R for the Rest of Us website.
Got any ideas for resources I should feature in future issues of What’s New in R? Leave a comment below!
Sign up for the newsletter
Get blog posts like this delivered straight to your inbox.

You need to be signed-in to comment on this post. Login.