
Resources
This carefully curated collection of resources will help you find packages and learning resources to help you on your R journey.
A Comprehensive Collection of U.S. Datasets • usdatasets
The usdatasets package provides an essential collection of U.S.-specific datasets suitable for analysis in various fields like crime, economics, education, and healthcare. It includes datasets with suffixes denoting their type, aiding in identification and usage. The package can be installed from CRAN and is easy to use, making it a valuable tool for researchers and analysts working with U.S. data. It follows a consistent naming convention to indicate data structures, such as time series (_ts) or data frames (_df), simplifying the data analysis process.
Go to Resource

DBI
The DBI package helps connecting R to database management systems (DBMS). It separates the connectivity to the DBMS into a “front-end” and a “back-end” and provides an interface that is implemented by different DBI backends. The package supports operations like connecting to a DBMS, executing statements, extracting results, and handling errors. The DBI package is typically installed automatically when you install one of the supported database backends.
Go to Resource
dbplyr
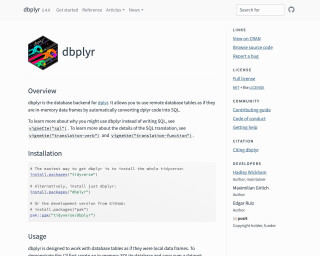
dbplyr is a database backend for the dplyr package in R. It allows you to use remote database tables as if they are in-memory data frames by automatically converting dplyr code into SQL.
Go to Resource
File Management With The {fs} Package
Albert Rapp's 'File Management With The {fs} Package' tutorial guides data scientists through various file system operations using the {fs} package in R. It demonstrates convenience functions that simplify tasks like path assembly, file extension modification, and directory information retrieval. Through examples, Rapp elucidates how to assemble paths regardless of trailing slashes, change file extensions for data transformation, and get directory details. The post includes code snippets and offers a video version for those who prefer learning through visual aids. Practical tips on iterating over file paths and creating organized output directories are also shared to enhance workflow efficiency.
Go to Resource

Four ways to write assertion checks in R
This content provides a personal narrative detailing the importance of writing assertion checks in R, particularly when dealing with data that can change structure over time. The author shares a transformation from a confident young analyst to one who has learned to be cautious and employ defensive programming techniques. The focus is on the 'identifier' function, illustrating the need for assertions with 'stopifnot()' to handle unexpected and incorrect inputs. The article emphasizes rigorous validation of assumptions to prevent silent errors in code.
Go to Resource

Full-Stack Survey Research with SurveyMonkey • svmkR
svmkR is an R package that provides a comprehensive toolkit for managing SurveyMonkey surveys within the R programming environment. It enables users to create, upload, download, and analyze surveys directly from R. Users can calculate margins of error, apply statistical survey weights through raking, and generate SurveyMonkey-style banner presentations for polls. The package is installed from GitHub and serves as a full-stack survey research solution. The source is available on GitHub, and the package was developed by a team of contributors, building on the surveymonkey package by enhancing and refactoring it.
Go to Resource
How to use R to dig for story ideas
The tutorial details the use of R for data journalism, particularly for investigating datasets to uncover story ideas. Highlighted at the Investigative Reporters and Editors conference by Charles Minshew, it emphasizes using R scripts, Tidyverse, and readxl packages to explore a dataset of Boston government employee earnings. By questioning datasets with basic R code, journalists can extract information such as salary attributes, department sizes, and common job titles. It also suggests using descriptive statistics to identify leads for stories, like discovering high earners within the data.
Go to Resource
Make simpler working with environmental data products • tidypollute
tidypollute is an R package designed to streamline the process of working with EPA AirData flat files and AQS API for environmental data analysis. Developed by Dr. Nelson Roque, the package provides tools for importing, cleaning, analyzing, and visualizing large-scale air pollution datasets. It's built with the tidyverse ethos, ensuring tidy and efficient data handling. Key features include processing EPA data files, extracting Atmotube Cloud API data, and soon to be added are real-time API queries, quick visualization tools, documentation generation, and demographic data integration.
Go to Resource
resouRces
This content encompasses a comprehensive list of R-related educational materials, packages, tutorials, and datasets with projected dates ranging up to the year 2025. It includes various titles that focus on learning R programming, data analysis, data visualization, geospatial mapping, and statistical methods. Significant emphasis is placed on resources for learning R, such as introductions to R, books, courses, and video tutorials. Additionally, specific packages for data wrangling, statistical modeling, and visualization are mentioned, indicating the evolution and specialization of R's ecosystem to cater to diverse data science needs.
Go to Resource


Using the tidyverse with Databases
Using the tidyverse with Databases - Part I is a tutorial that provides an introduction to using databases in R with Tidyverse tools. The tutorial covers topics such as motivation, connecting to a database, using DBI and dplyr functions, executing queries with dbplyr, and more.
Go to Resource
Vizualizing global testosterone levels by country
This article by Aspire Data Solutions outlines the process of web scraping testosterone levels for different countries from the World Population Review website and creating a choropleth map to visualize the data in R. It demonstrates how to gather, clean, and plot geographical data, cautioning that this ecological dataset is approximate, not age-standardized, and should be used for identifying patterns rather than for precise comparisons or causal inferences. The author, Mihiretu Kebede (PhD), also includes code snippets and explanations for the R packages used.
Go to Resource