
Resources
This carefully curated collection of resources will help you find packages and learning resources to help you on your R journey.
Albert Rapp - Creating interactive visualizations with {ggiraph} (with or without Shiny)
Creating interactive visualizations with ggiraph (with or without Shiny)
Go to Resource
Chat with Large Language Models • {ellmer}
The 'ellmer' package facilitates the use of large language models (LLMs) directly from R. It provides access to multiple LLM providers and features like streaming outputs and structured data extraction. 'ellmer' supports models such as Anthropic's Claude, AWS Bedrock, and OpenAI's GPT, among others. The package offers interactive and programmatic ways to converse with models, maintaining the conversation state, which is useful for building on previous interactions. 'ellmer' is practical for both organizational and personal use, accommodating various IT restrictions and preferences.
Go to Resource

Creating interactive visualizations with {ggiraph} (with or without Shiny)
Albert Rapp's blog post explains how to create interactive visualizations using the {ggiraph} package with or without Shiny in the R programming environment. It guides readers through the process of turning a ggplot into an interactive plot where users can focus on details that interest them. The tutorial includes data preparation with 'dplyr' and 'ggplot2', and demonstrates how to add interactivity to both lines and points in a chart. The post covers the use of 'geom_point_interactive', 'geom_line_interactive', and 'girafe()' function for rendering, and customization options for hover effects and plot sizing.
Go to Resource
From RStudio to Positron: A Better Data Science IDE (R and Python)
Susan Buck offers a guided tour of Positron, Posit’s newer data science IDE built for both R and Python. The video walks through the Positron interface—including the activity bar, editor, console, and sidebars—and draws direct comparisons to familiar RStudio workflows to help users orient themselves quickly.
Go to Resource
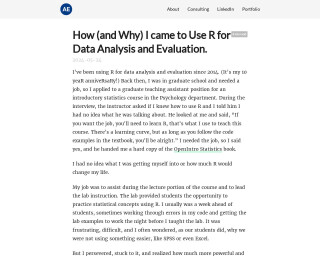
How (and Why) I came to Use R for Data Analysis and Evaluation
Alberto Espinoza recounts his journey with R for data analysis and evaluation, marking his 10-year experience since first encountering R during his graduate assistantship. Initially clueless about R, he was tasked with assisting and leading statistics labs using R. Despite early challenges and a steep learning curve, he recognized R's power over software like SPSS or Excel. His continued use of R spanned graduate projects, market research, data preparation for Tableau, and Survey Monkey analysis. Espinoza outlines R's advantages: reproducibility, efficiency, clarity, and an extensive package ecosystem, underlining R's significance in his professional growth.
Go to Resource

Interactive web-based data visualization with R, plotly, and shiny
This book provides insight and practical skills for creating interactive and dynamic web graphics for data analysis using R, plotly, and shiny.
Go to Resource
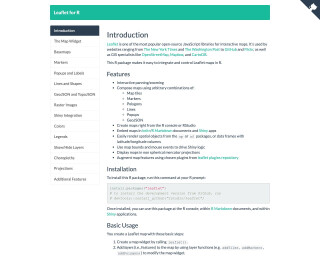
leaflet
Leaflet for R is an R package that makes it easy to integrate and control Leaflet maps in R. It provides interactive panning/zooming, the ability to compose maps using various map elements, and integration with Shiny apps. The package allows users to create maps from the R console or RStudio, embed maps in knitr/R Markdown documents and Shiny apps, and render spatial objects from the sp or sf packages. The package is widely used by websites, GIS specialists, and data visualization professionals.
Go to Resource

mapdeck
An R library for plotting large datasets on interactive maps using Mapbox GL and Deck.gl
Go to Resource

Modern Data Visualization with R
Modern Data Visualization with R is a comprehensive guide by Robert Kabacoff on data visualization techniques using the R programming language. This book, available in both online and print versions, emphasizes the use of ggplot2 for creating a variety of charts and plots. Covering topics from importing and cleaning data to customizing and saving graphs, the book includes worked examples and best practices to help readers create publication-ready graphics. The content also introduces interactive graphing tools and offers advice on graph aesthetics such as color choice and signal-to-noise ratio.
Go to Resource

Quarto Extensions
This content presents a catalog of various Quarto extensions, complete with metadata such as the release date, author, version, and the number of stars on GitHub. The extensions cover a wide array of functionalities to enhance HTML documents, websites, blogs, books, and academic publications. Some specific features include embedding webR, minimalist themes for presentations, APA7 document formatting, countdown timers, inclusion of vector icons, and integration of interactive elements like Shinylive and code editors. The Quarto extensions support a diversity of outputs, such as PDF, HTML, and slides, and cater to needs in publishing, theming, and interactivity.
Go to Resource
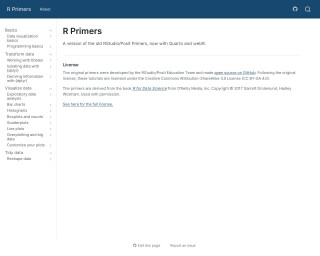
R Primers
R Primers offer updated RStudio/Posit educational content, now utilizing Quarto and webR. Originally developed by RStudio/Posit Education Team, these open-source tutorials help users learn R programming, deriving content from the book 'R for Data Science'. They are licensed under the CC BY-SA 4.0, ensuring wide accessibility for learners to improve their data science skills with R.
Go to Resource