
Resources
This carefully curated collection of resources will help you find packages and learning resources to help you on your R journey.
Bluesky conversation analysis with local and frontier LLMs with R/Tidyverse
This content details the author's exploration of bluesky conversation analysis using R and the Tidyverse suite, specifically focusing on local and frontier large language models (LLMs). The author leverages R packages atrrr, ellmer in the tidyverse, mlverse/mall, and interfaces with models such as Claude & Ollama. Processes include summarizing posts, performing sentiment analysis, and posting summaries to GitHub via the gistr R package. Techniques include data retrieval, text analysis, and summarization, showcasing how open models can provide insights into community discussions on Bluesky, particularly within the R community's use of the #Rstats hashtag.
Go to Resource
Book announcement R 4 Social Network Analysis
The blog post 'R 4 Social Network Analysis' announces an in-progress book aimed at introducing social network analysis (SNA) in R to practitioners. Authored by schochastics and Termeh Shafie, both of whom have extensive experience in SNA and R package development, the book will cover key SNA topics and demonstrate how to manage network analytical tasks in R. It addresses the scarcity and dispersal of current SNA learning materials and seeks to provide a central, up-to-date source. The book's practical focus is on applying R tools rather than delving into theory, making it suitable for those ready to apply SNA techniques. It is openly written on GitHub using quarto, inviting community feedback through issues.
Go to Resource
Creating post summary with AI from Hugging Face
Dr. Mowinckel discusses the use of Hugging Face's AI to automate the creation of SEO-friendly summaries for blog posts, which is both time-efficient and enhances discoverability. The tutorial encompasses acquiring the Hugging Face API key, structuring requests, and handling responses with the R package httr2. It also highlights the importance of concise summaries for both SEO and repository metadata, and details the workflow from content preparation to writing summaries to a file. Hugging Face’s community efforts and accessible APIs are commended for their ease of use and functionalities.
Go to Resource

Helpers for Automatic Translation of Markdown-based Content • babeldown
babeldown is an R package designed for automatically translating Markdown-based R content with the help of the DeepL API. It facilitates the translation of Markdown strings, files, Quarto book chapters, and Hugo blog posts. The package offers a straightforward installation process through rOpenSci R-universe or GitHub. It supports the free and Pro plans of the DeepL API, requiring configuration of the API URL and key. Features like recommended line-wrapping practices and troubleshooting tips for common issues, such as punctuation mix-ups and API credit exhaustion, are provided. RStudio users can also benefit from integrated features.
Go to Resource
How (and Why) I came to Use R for Data Analysis and Evaluation
Alberto Espinoza recounts his journey with R for data analysis and evaluation, marking his 10-year experience since first encountering R during his graduate assistantship. Initially clueless about R, he was tasked with assisting and leading statistics labs using R. Despite early challenges and a steep learning curve, he recognized R's power over software like SPSS or Excel. His continued use of R spanned graduate projects, market research, data preparation for Tableau, and Survey Monkey analysis. Espinoza outlines R's advantages: reproducibility, efficiency, clarity, and an extensive package ecosystem, underlining R's significance in his professional growth.
Go to Resource
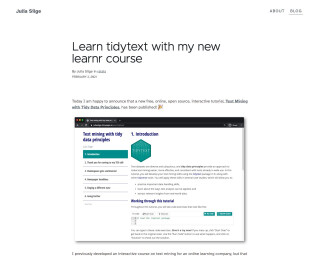
Learn tidytext with my new learnr course | Julia Silge
Learn tidytext with my new learnr course
Go to Resource
LibreTranslate API for R: translate, detect languages
libretranslateR is an R package that provides a binding to the LibreTranslate API, enabling users to perform translation tasks, detect languages, and list available languages for translation, all from within R. The package includes a user-friendly wizard for configuration, and allows connections to any LibreTranslate instance, offering flexibility and offline translation capabilities by hosting your own instance. Currently not available on CRAN, it can be installed directly from GitHub via the 'remotes' package, and comes with features like auto-detection of languages, translation without leaving R, and future enhancements like file translation and more user-friendly language names.
Go to Resource
Ordering images of toast from least toasted to most toasted...
The GitHub repository 'toast' by cj-holmes is a unique project that involves organizing images of toast based on their level of toasting, from least to most toasted. It provides an analytical approach to the humorous question of the best way to 'toast a toast' using R and ImageMagick. The repository includes code to read and analyze an image of toast, select pixel values, and visualize them to identify the level of toasting. It leverages packages from the tidyverse and uses ggplot for visualization and magick for image processing to create a greyscale intensity from RGB values of pixels.
Go to Resource
Quantitative Analysis of Textual Data with {quanteda}
The quanteda package is an R tool for text analysis, offering functions for processing natural language and managing textual data. It was developed by Kenneth Benoit and Kohei Watanabe with the support of the European Research Council and Quanteda Initiative CIC. quanteda is particularly useful for researchers and students, providing many features that rival proprietary software, but with the openness and flexibility of R. Version 4.0 introduced improved functionality and smarter tokenisation with Unicode support. The package ecosystem has grown into a family, including modules for text modeling, text statistics, text plotting, and sentiment analysis.
Go to Resource
resouRces
This content encompasses a comprehensive list of R-related educational materials, packages, tutorials, and datasets with projected dates ranging up to the year 2025. It includes various titles that focus on learning R programming, data analysis, data visualization, geospatial mapping, and statistical methods. Significant emphasis is placed on resources for learning R, such as introductions to R, books, courses, and video tutorials. Additionally, specific packages for data wrangling, statistical modeling, and visualization are mentioned, indicating the evolution and specialization of R's ecosystem to cater to diverse data science needs.
Go to Resource
The best R packages for data visualization
The best R packages for data visualization provide a comprehensive suite of tools for creating all types of charts and graphs. Core to R's visualization capabilities is the package ggplot2, which offers a versatile grammar of graphics. Extensions of ggplot2 and other packages expand these functionalities, allowing for interactive charts, improved aesthetics, specialized geospatial analysis, and managing complex data structures like networks. Packages like plotly, rmarkdown, patchwork, and hrbrthemes enhance the user experience and presentation. Additionally, there are packages dedicated to managing colors, creating tables, and supporting specific chart types like word clouds and streamgraphs.
Go to Resource