
Resources
This carefully curated collection of resources will help you find packages and learning resources to help you on your R journey.
Outliers in Data Analysis: Detecting Extreme Values Before Modeling in R
This content provides a comprehensive guide on detecting outliers in data analysis before modeling using R, with a specific focus on Airbnb listings data from Istanbul. It emphasizes the importance of understanding the statistical implications of outliers and how they can distort statistical analysis and modeling efforts. The guide demonstrates practical outlier detection methods and includes R code for loading and pre-processing the Airbnb dataset, while also discussing relevant statistical concepts and the importance of making informed preprocessing decisions. Example variables such as price, minimum_nights, and room_type are used for illustration.
Go to Resource
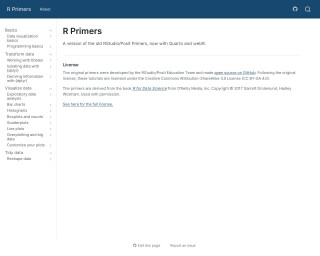
R Primers
R Primers offer updated RStudio/Posit educational content, now utilizing Quarto and webR. Originally developed by RStudio/Posit Education Team, these open-source tutorials help users learn R programming, deriving content from the book 'R for Data Science'. They are licensed under the CC BY-SA 4.0, ensuring wide accessibility for learners to improve their data science skills with R.
Go to Resource
resouRces
This content encompasses a comprehensive list of R-related educational materials, packages, tutorials, and datasets with projected dates ranging up to the year 2025. It includes various titles that focus on learning R programming, data analysis, data visualization, geospatial mapping, and statistical methods. Significant emphasis is placed on resources for learning R, such as introductions to R, books, courses, and video tutorials. Additionally, specific packages for data wrangling, statistical modeling, and visualization are mentioned, indicating the evolution and specialization of R's ecosystem to cater to diverse data science needs.
Go to Resource
Trying out dplyr 1.2.0
Crystal Lewis experiments with the new dplyr 1.2.0 features in her article, demonstrating the improved filtering and recoding functions. The Posit team's latest update to this essential R package simplifies data cleaning processes with functions like filter_out(), recode_values(), replace_values(), and replace_when(). With practical examples, Lewis showcases the enhancements and provides a smooth introduction to these changes, making data wrangling more intuitive in R.
Go to Resource
Vizualizing global testosterone levels by country
This article by Aspire Data Solutions outlines the process of web scraping testosterone levels for different countries from the World Population Review website and creating a choropleth map to visualize the data in R. It demonstrates how to gather, clean, and plot geographical data, cautioning that this ecological dataset is approximate, not age-standardized, and should be used for identifying patterns rather than for precise comparisons or causal inferences. The author, Mihiretu Kebede (PhD), also includes code snippets and explanations for the R packages used.
Go to Resource
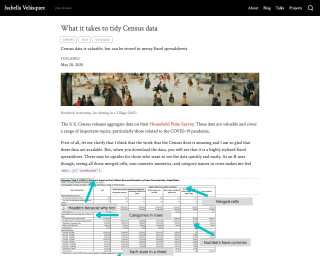
What is Takes to Tidy Census Data
This article explains the process of tidying Census data using R and tidyverse packages.
Go to Resource