
Resources
This carefully curated collection of resources will help you find packages and learning resources to help you on your R journey.
Object-Oriented Diagram Plots with ggplot2 • ggdiagram
The 'ggdiagram' package enhances the ggplot2 ecosystem by providing tools for creating object-oriented diagrams in R. Inspired by the TikZ LaTeX system, 'ggdiagram' integrates with ggplot2 through additional functions, such as 'annotate' extensions, leveraging other packages like 'ggtext', 'ggforce', and 'ggarrow'. It's not a substitute for standard ggplot2 functions but complements them for designing interrelated visual objects. Installation instructions include CRAN and R-universe options. Examples demonstrate creating and connecting geometric shapes, with the result formatted in a ggplot style suitable for data visualization and diagrammatic illustrations.
Go to Resource
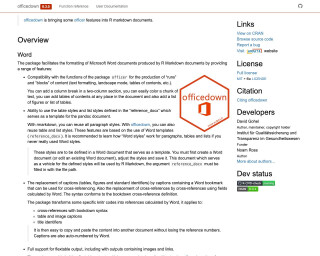
officedown
officedown is an R package that enhances the formatting of Microsoft Word and PowerPoint documents produced by R Markdown. It provides features such as compatibility with the functions of the package officer, the ability to use table styles and list styles defined in a Word template, and support for flextable output. officedown also enhances PowerPoint productions by providing a mechanism for placing results according to a slide template contained in the PowerPoint document. For more information, refer to the package documentation.
Go to Resource
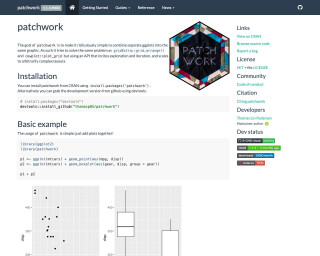
patchwork 1.3.0
patchwork 1.3.0 introduces exciting new features for creating multifigure plot compositions, adding support for beautifully formatted tables alongside figures with native support for gt objects. Enhanced by Teun Van den Brand's contributions, it allows users to seamlessly integrate tables using the wrap_elements() method or with table-specific formatting via wrap_table(). This version optimizes the space utilization of tables within plots, aligning components perfectly and providing formatting options for an improved aesthetic and functional integration of data visualizations and tabular presentations.
Go to Resource
Price index data for the US economy
The 'realtalk' R package provides datasets for common US price indexes such as the CPI-U-RS and PCE. It enables easy access and manipulation of price index data. Users can view available datasets and obtain specific price index data through functions like available_price_indexes and get_price_index(). The package also includes annual, monthly, and quarterly data with various start and end dates. Installation instructions are provided for getting started with the package. This can be especially useful for economists and data analysts working with time series data in the economic domain.
Go to Resource
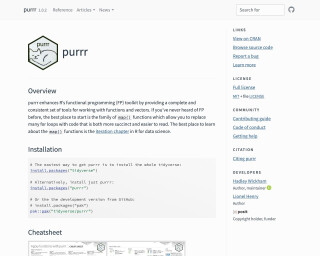
purrr
Purrr is a package in R that enhances functional programming (FP) toolkit by providing a complete and consistent set of tools for working with functions and vectors.
Go to Resource
Qualitative Analysis with Large Language Models • quallmer
The quallmer package leverages AI, particularly large language models, for qualitative data analysis. It assists researchers in coding texts, images, PDFs, tabular, and structured data. quallmer simplifies AI-assisted qualitative coding, ensuring the quality and reliability of AI-generated codes with functions for codebook creation, coding, comparison, validation, replication, and documenting audit trails. It supports all LLMs available with the ellmer package and includes a Shiny app for an interactive experience.
Go to Resource
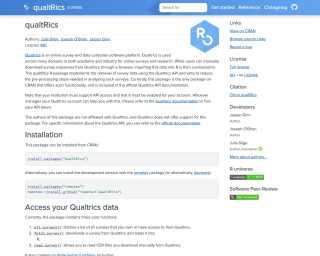
qualtRics
The qualtRics R package implements the retrieval of survey data using the Qualtrics API and aims to reduce the pre-processing steps needed in analyzing such surveys.
Go to Resource
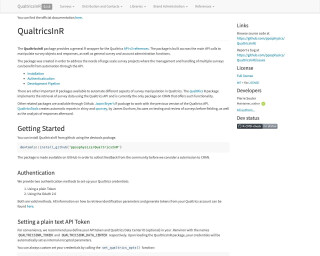
Quantitative Analysis of Textual Data with {quanteda}
The quanteda package is an R tool for text analysis, offering functions for processing natural language and managing textual data. It was developed by Kenneth Benoit and Kohei Watanabe with the support of the European Research Council and Quanteda Initiative CIC. quanteda is particularly useful for researchers and students, providing many features that rival proprietary software, but with the openness and flexibility of R. Version 4.0 introduced improved functionality and smarter tokenisation with Unicode support. The package ecosystem has grown into a family, including modules for text modeling, text statistics, text plotting, and sentiment analysis.
Go to Resource

Quarto Extensions
This content presents a catalog of various Quarto extensions, complete with metadata such as the release date, author, version, and the number of stars on GitHub. The extensions cover a wide array of functionalities to enhance HTML documents, websites, blogs, books, and academic publications. Some specific features include embedding webR, minimalist themes for presentations, APA7 document formatting, countdown timers, inclusion of vector icons, and integration of interactive elements like Shinylive and code editors. The Quarto extensions support a diversity of outputs, such as PDF, HTML, and slides, and cater to needs in publishing, theming, and interactivity.
Go to Resource