
Resources
This carefully curated collection of resources will help you find packages and learning resources to help you on your R journey.

Getting started with theme()
This content is a tutorial on the theme() function in the ggplot2 package for R. It provides a practical guide to customizing the appearance of plots using theme(), starting from basic modifications to more advanced tweaks. The tutorial includes examples of modifying plot themes with pre-built ggplot2 themes and the use of the theme() function. It discusses altering legend positions, grid lines, and more nuanced theme elements for personalizing plots. The content is designed to help readers become comfortable and confident in adjusting plot aesthetics to match their preferred style or organizational standard.
Go to Resource
ggplot2 styling
This content introduces the styling capabilities of the ggplot2 package, explaining how to apply various themes to enhance the visual appearance of plots. It covers the theme system in ggplot2, including new updates, and guides the reader through using pre-existing themes or creating custom theme functions. Different components like panels, axes, titles, and legends are addressed, and a practical example plot is provided. The article also mentions additional themes available through packages like cowplot, ggthemes, and tvthemes, which offer styles inspired by external sources or even TV shows.
Go to Resource
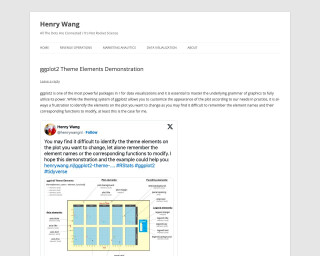
ggplot2 Theme Elements Demonstration | Henry Wang
This is a demonstration by Henry Wang about customizing theme elements in ggplot2, a powerful package in R for data visualizations. The demonstration provides step-by-step instructions on how to identify and modify theme elements in ggplot2.
Go to Resource
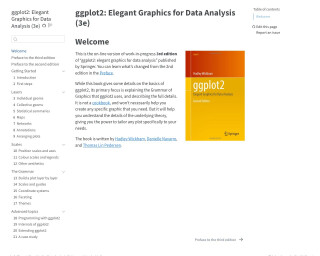
ggplot2: elegant graphics for data analysis
This is the online version of the work-in-progress 3rd edition of 'ggplot2: Elegant Graphics for Data Analysis'. The book focuses on explaining the Grammar of Graphics used in ggplot2 and provides details on the underlying theory. It is written by Hadley Wickham, Danielle Navarro, and Thomas Lin Pedersen.
Go to Resource
Git & GitHub: Practical Version Control for Data Work
R-Ladies Rome hosted a tutorial titled 'Git & GitHub: Practical Version Control for Data Work' on January 29, 2026. The session provided a beginner-friendly, workflow-oriented introduction to Git and GitHub for those working with data and research. It started with the basics of terminal and shell concepts, then covered local version control with Git, essential commands, and undo strategies, before integrating GitHub for sharing and collaboration. Federica Gazzelloni led the tutorial, emphasizing a clear understanding first before diving into practice. Resources included a workshop guide, slides, and a recording for self-paced learning. The aim was to demystify version control and foster reproducible workflows for data work.
Go to Resource
Git for Humans
A talk by Alice Bartlett at UX Brighton 2016 about using Git for humans.
Go to Resource
GitHub - cj-holmes/toast: Ordering images of toast from least toasted to most toasted...
Ordering images of toast from least toasted to most toasted using R language
Go to Resource
GitHub - teunbrand/ggplot_tricks: Here, I collect some tricks I've learned about the {ggplot2} R package
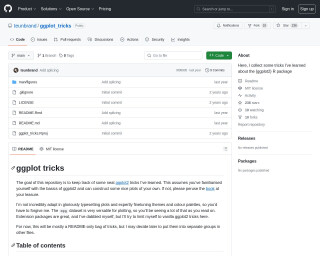
A collection of tricks and tips for using the ggplot2 R package.
Go to Resource
GitHub - teunbrand/ggplot_tricks: Here, I collect some tricks I've learned about the {ggplot2} R package
A collection of tricks and tips for using the ggplot2 R package.
Go to Resource

golem
golem is an opinionated framework for building production-grade shiny applications.
Go to Resource
Greenland ice thickness
This resource provides a tutorial on using R to visualize the thickness of Greenland's ice, based on data from Bamber (2001). The data is formatted as a fixed width ASCII file and requires wrangling to be processed with R packages such as terra, readr, dplyr, and tidyr. After cleaning and projecting the data into a suitable format, the resource guides creating both raw and interactive polar stereographic maps. The tutorial includes R code snippets, methods for arranging and visualizing the data with ggplot2 and leaflet, and a discussion on the relevance of ice thickness in Arctic studies.
Go to Resource