
Resources
This carefully curated collection of resources will help you find packages and learning resources to help you on your R journey.
stars
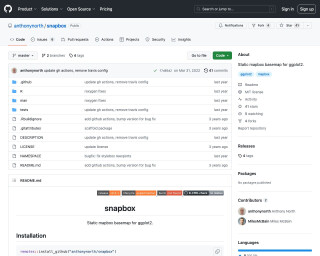
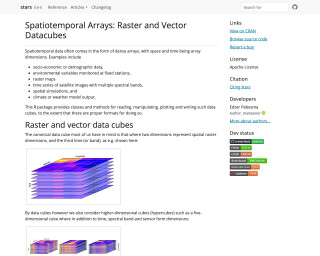
stars is an R package that provides classes and methods for reading, manipulating, plotting, and writing spatiotemporal data cubes. It supports both raster and vector data cubes, as well as regular and irregular grids. The package uses GDAL and PROJ for raster and vector operations, and provides out-of-memory (on-disk) rasters for handling large datasets. The package also includes methods for time series analysis of spatiotemporal data.
Go to Resource
statebins
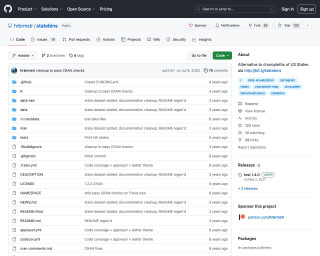
statebins is an R package that provides an alternative to choropleth maps for the United States. It generates cartogram heatmaps based on the work by the Washington Post graphics department. The package includes functions for creating binned or continuous scales, legends, and different visualizations using state data.
Go to Resource


stringr.plus
stringr.plus provides additional functions for working with strings, especially for extracting specific text from URLs and file paths. It is a package for the R programming language.
Go to Resource
tablerDash
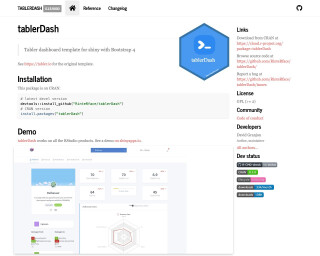
Tabler API for Shiny is a package that provides a tablerDash template for creating dashboards in Shiny applications. It is based on Bootstrap 4 and offers a responsive UI design. The package can be installed from CRAN or from the GitHub repository. It works with all RStudio products and has a demo available on shinyapps.io. The package is developed by David Granjon and is licensed under GPL (>= 2).
Go to Resource
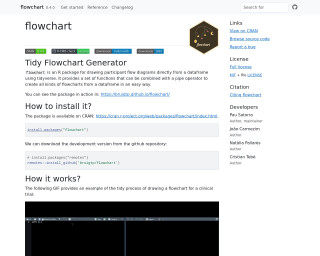
Tidy Flowchart Generator
The Tidy Flowchart Generator, or the 'flowchart' package, is an R package designed for drawing participant flow diagrams directly from a dataframe, employing the tidyverse syntax. It offers a suite of functions that utilize the pipe operator to generate flowcharts conveniently and flexibly from dataframes. The package is accessible through CRAN and can be installed traditionally or via the development version on GitHub. The process of creating a flowchart with this tool is demonstrated through a GIF example on its homepage, showcasing its usefulness in drafting flow diagrams for clinical trials or similar studies.
Go to Resource
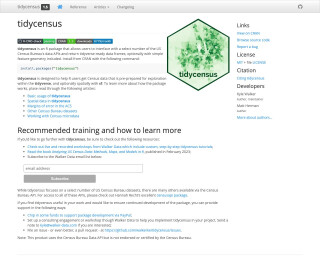
tidycensus
Load US Census Boundary and Attribute Data as tidyverse and sf-Ready Data Frames
Go to Resource
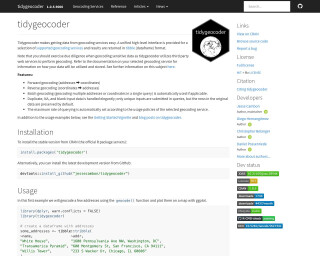
tidygeocoder
Tidygeocoder is an R package that makes getting data from geocoding services easy. It provides a unified high-level interface for a selection of supported geocoding services and returns results in tibble (dataframe) format.
Go to Resource
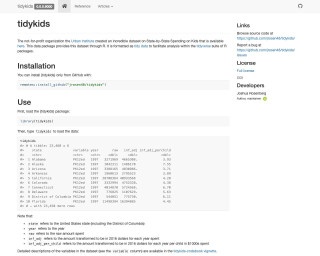
tidykids
State-by-State Spending on Kids Dataset from the Urban Institute in a Tidy Format
Go to Resource
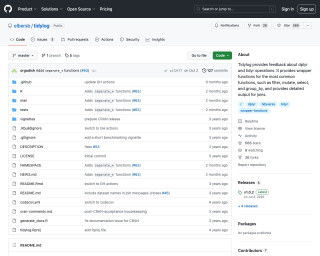
tidylog
Tidylog provides feedback about dplyr and tidyr operations. It provides wrapper functions for the most common functions, such as filter, mutate, select, and group_by, and provides detailed output for joins.
Go to Resource
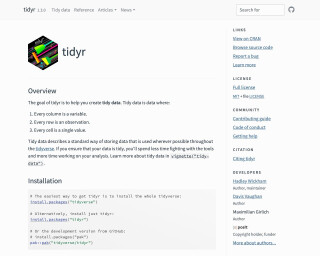
tidyr
The `tidyr` package in R is used to create tidy data, where every column is a variable, every row is an observation, and every cell is a single value. It provides functions for pivoting, rectangling, nesting, splitting and combining character columns. The package supersedes `reshape2` and `reshape` and is designed specifically for tidying data. It has an active community and a Contributor Code of Conduct.
Go to Resource