
Resources
This carefully curated collection of resources will help you find packages and learning resources to help you on your R journey.
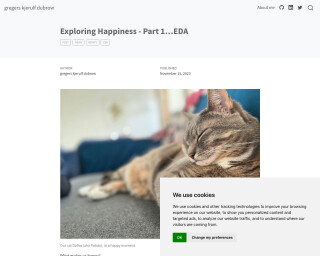
gregers kjerulf dubrow - Exploring Happiness - Part 1…EDA
This text is about exploring happiness and conducting exploratory data analysis using R language. It discusses the World Happiness Report data and the process of importing and cleaning the data in RStudio. The author also mentions using packages like DataExplorer and explorer for EDA. The text provides code snippets for data loading and mentions the use of tidyverse, tidylog, and janitor packages.
Go to Resource
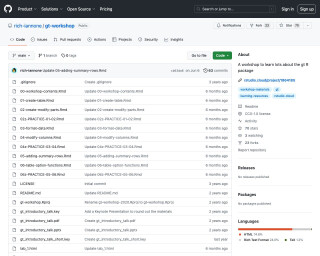
Hadley Wickham @ Posit | Giving benefit to people using what you build | Data Science Hangout - YouTube
A Data Science Hangout interview with Hadley Wickham, discussing the philosophy of giving benefit to people using the tools he builds.
Go to Resource


Happy Git with R
Happy Git and GitHub for the useR provides instructions on how to install and use Git and GitHub with R and R Markdown. It covers key workflows and demonstrates the synergy between R/R Markdown/RStudio and GitHub. The target audience includes those who use R for data analysis or work on R packages.
Go to Resource
Hillshade effects
Dr. Dominic Royé's blog post on hillshade effects explains creating relief maps in R with shadow effects to generate visual depth. He uses several R packages, including 'sf' for vector data, 'elevatr' for elevation API access, 'terra' for raster manipulation, 'whitebox' for geospatial analysis, and 'ggplot2' extensions for scales and color blending. The tutorial covers installing packages, importing and filtering lake boundaries, and manipulating Digital Elevation Models (DEMs) for Switzerland, with reproducible R code snippets.
Go to Resource
Homelessness and Rents in Canada
This content is a comprehensive R code walkthrough for analyzing homelessness and rent data in Canada. It uses multiple R libraries, including the tidyverse for data wrangling, can census for accessing census data, and patchwork for visualizing data. Important steps include data import, cleaning, and transforming with functions like mutate, filter, and summarize. Quantile calculations for rents and adjustments for CPI are shown to assess real rents over time. It highlights metros like Vancouver and Toronto, using colors to represent different years. The code indicates a rich, data-driven analysis and visualization process focusing on socio-economic issues of homelessness and rents.
Go to Resource
How (and Why) I came to Use R for Data Analysis and Evaluation
Alberto Espinoza recounts his journey with R for data analysis and evaluation, marking his 10-year experience since first encountering R during his graduate assistantship. Initially clueless about R, he was tasked with assisting and leading statistics labs using R. Despite early challenges and a steep learning curve, he recognized R's power over software like SPSS or Excel. His continued use of R spanned graduate projects, market research, data preparation for Tableau, and Survey Monkey analysis. Espinoza outlines R's advantages: reproducibility, efficiency, clarity, and an extensive package ecosystem, underlining R's significance in his professional growth.
Go to Resource
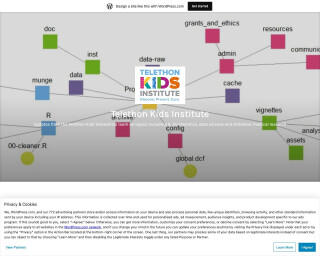
How Do You Organise Your R Project? This Is What We Do.
This blog post discusses how the Biometrics group at Telethon Kids Institute organizes their R projects using a standardized template project directory. The post covers the project directory structure, reproducible research practices, and the use of version control.
Go to Resource
How I’m using Claude Code to write R code
Simon P. Couch discusses his experiences using Claude Code to write R code, including initial impressions, subsequent reduced usage, and recent enhancements leading to more effective use. He highlights the importance of providing the model with adequate context to understand the project, through techniques such as creating a CLAUDE.md file with instructions and project-specific information. Couch details how incorporating the Model Context Protocol, slash commands, and external documentation improved his workflow. By facilitating model access to R package documentation and setting up an MCP server, he can now use Claude Code more efficiently for coding assistance.
Go to Resource
How Major League Teams use R to Analyze Baseball Data
Keith Woolner, on September 27, 2023, delivers a presentation showcasing how Major League Baseball teams utilize the R programming language to perform data analysis on baseball statistics. The video, available on YouTube, dives into methodologies and tools used within the industry to crunch numbers and derive insights that can potentially give teams a competitive edge. It touches upon predictive modeling, player performance evaluation, and related statistical techniques, evidencing R's pivotal role in sports analytics and data-driven decision-making in professional baseball.
Go to Resource
How many cars are there in Madison?
Harald Kliems analyzes car ownership in Madison using the American Community Survey data to examine trends over time. His study reveals periods of growth and stagnation in car numbers. By plotting the data, Harald provides a visual representation of these trends in comparison to Seattle. The analysis also includes looking at households in Madison to contextualize the car ownership data, calculating cars per 100 households to understand the implications of city growth on transportation. The article uses R code snippets to demonstrate data extraction, transformation, and visualization.
Go to Resource