
Resources
This carefully curated collection of resources will help you find packages and learning resources to help you on your R journey.
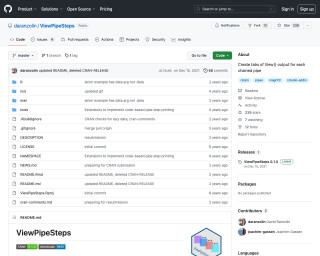
Voice control ggplot2 with ggbot2
Stephen Turner introduces ggbot2, a tool for controlling ggplot2 visualizations with voice commands. By installing ggbot2 from the tidyverse GitHub repository, users can launch a Shiny app to interact with the mtcars dataset. Voice commands enable actions like creating scatter plots, adjusting colors and sizes of points, switching themes, and reverting changes. The user-friendly ggbot2 enhances data exploration with a hands-free, efficient approach to crafting ggplot2 charts, making data visualization more accessible and interactive.
Go to Resource
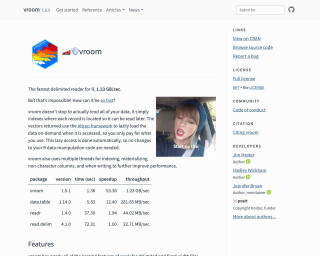
vroom
vroom is a package in R that provides the fastest delimited reader. It uses lazy loading and multiple threads for improved performance. It supports various parsing features, such as delimiter guessing, custom delimiters, column types specification, and more.
Go to Resource

xaringan
Presentation Ninja with xaringan - a tutorial and package for creating presentations in R using the xaringan package
Go to Resource

xaringanBuilder
renderthis is an R package for generating HTML slideshows using the xaringan package.
Go to Resource


xaringanExtra
xaringanExtra is a package in R that provides additional functionality and features for creating presentations using the xaringan package.
Go to Resource

xaringanthemer
Custom xaringan CSS Themes for styling xaringan slides in RMarkdown with xaringanthemer
Go to Resource
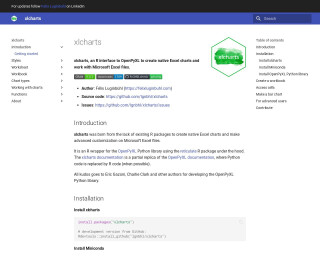
xlcharts
xlcharts is an R package that serves as an interface to the OpenPyXL Python library, enabling the creation of native Excel charts within R. Aimed at overcoming the limitations of existing R packages in terms of Excel chart creation and customization, xlcharts allows users to generate Excel charts and perform advanced Excel file manipulations. Users can install xlcharts and its dependencies (Miniconda and OpenPyXL), access and edit workbook cells, and create various types of charts such as bar, bubble, and pie. It supports styles, conditional formatting, worksheet operations, pivot tables, comments, formulae, and workbook protection.
Go to Resource
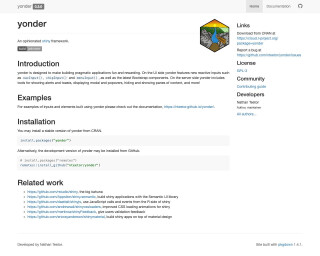
yonder
yonder is a reactive web framework built on shiny. It features new reactive inputs and Bootstrap components on the UI side, and tools for alerts, modals, and more on the server side.
Go to Resource
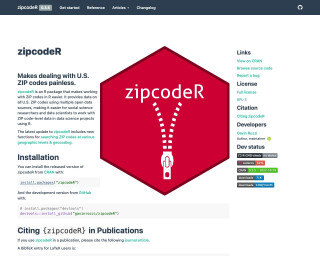
zipcodeR
zipcodeR is an R package that makes working with ZIP codes in R easier. It provides data on all U.S. ZIP codes using multiple open data sources, making it easier for social science researchers and data scientists to work with ZIP code-level data in data science projects using R.
Go to Resource