
Resources
This carefully curated collection of resources will help you find packages and learning resources to help you on your R journey.
Images as Facet Labels in ggplot2
In this tutorial by Dr. U, readers learn how to use ggplot2 in conjunction with ggtext and ggh4x to replace facet labels with images, specifically country flags. After loading the necessary packages, the tutorial explains how to retrieve and preprocess country codes and names using the jsonlite package. It guides through joining the country code data with the gapminder dataset and handling missing countries. Steps to download flag images and integrate them into ggplot2 faceting are then provided. The post details creating markdown with ggtext to display images within the plot, enhancing data visualization in R.
Go to Resource
Inserted maps with ggplot2
This blog post by Dr. Dominic Royé illustrates how to create maps in R using ggplot2, with a focus on positioning outermost territories like the Canary Islands near the main map of Spain or inserting an orientation map. The tutorial includes the use of packages from the tidyverse collection and others like mapSpain and sf for handling administrative boundaries and vector data. Option 1 details shifting the Canary Islands to a common position, while Option 2 explains creating separate objects for territories without displacement for geographic accuracy.
Go to Resource
Interactive beeswarm charts in R
This content outlines the process of creating interactive beeswarm charts in R, as described by Nicola Rennie in a blog post. Beeswarm charts display distributions by allowing individual data points to be seen, preventing overlap to resemble a swarm of bees. The post details data preparation, including data wrangling steps using 'dplyr' and sorting categories for meaningful presentation. The dataset used demonstrates health by sexual orientation from the UK's LGBTQ+ census data. Additionally, it describes an initiative encouraging visualizations of LGBTQ+ data for LGBTQ+ History Month. The reader is guided through R code snippets to load, prepare, and plot the data.
Go to Resource

Interactive web-based data visualization with R, plotly, and shiny
This book provides insight and practical skills for creating interactive and dynamic web graphics for data analysis using R, plotly, and shiny.
Go to Resource
Introducing Databot: An AI assistant for exploratory data analysis
Databot is an AI-powered assistant developed by Posit to augment the exploratory data analysis (EDA) capabilities of data scientists who use Python or R. This ambitious application of large language models (LLMs) aims to fast-track the EDA process, which conventionally takes hours, down to just minutes. Unlike autonomous or sandbox-constrained AI agents, Databot works interactively in a highly collaborative 'pair programming' style, engaging the user with rapid code-writing, execution, and analysis. It employs a cycle termed the 'WEAR loop' to ensure insights are reliable, serendipitous, and transparent. Databot remains a research preview exclusively available for Positron users.
Go to Resource
Introducing Posit AI
Simon P. Couch announces the release of Posit AI, a new AI service for data scientists, which comprises Posit Assistant and Next Edit Suggestions. Posit Assistant acts as a data science and coding agent, combining aspects of Claude Code with Databot, offering users a sophisticated coding experience. Next Edit Suggestions provide advanced autocomplete capabilities and are initially available in RStudio, with plans to extend to other platforms. Simon highlights the effort put into making Posit AI practical for everyday use and mentions the upcoming detailed post about the Next Edit Suggestions system.
Go to Resource
Introduction to Geospatial Raster and Vector Data with R
This lesson covers how to open, work with, and plot vector and raster-format spatial data in R. It also includes topics such as working with spatial metadata, reprojecting spatial data, and working with raster time series data.
Go to Resource
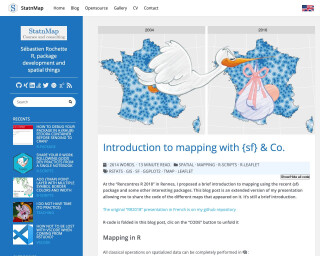
Introduction to mapping with {sf} & Co.
This blog post is an extended version of a presentation on mapping using the {sf} package and other related packages in R. It covers topics such as reading and exploring spatial data, manipulating attributes, geomatics processing, and creating static and interactive maps. The post also touches on the importance of projections and provides an example of projecting the map of Metropolitan France. The code for the different maps presented in the post is included.
Go to Resource

Introduction to Open Data Science: GitHub
This chapter covers the topic of using GitHub for collaboration in open data science projects. It includes objectives and resources for learning about Git and GitHub, setting up Git & GitHub, creating and cloning repositories, syncing files between local and remote repositories, exploring remote GitHub, and collaborating with GitHub.
Go to Resource

Introduction to web scraping
Stein Arne Brekke provides an introductory guide to web scraping judicial data in R, focusing on creating a dataset from UK Supreme Court decisions. Emphasizing empirical legal studies, the guide covers data gathering from online sources through programming. It offers a step-by-step process for scraping and organizing data into usable tables for research, using R. Beginners are pointed to additional learning resources, and the guide includes sections on scraping, data management, analysis, and legal considerations. It encourages sharing collected data to aid comparative legal research.
Go to Resource
Iterate parameterised {xaringan} reports
Learn how to iterate parameterised xaringan reports using R. This tutorial demonstrates how to create a parameterised R Markdown template and iterate over parameter values to generate multiple reports with different data.
Go to Resource