
Resources
This carefully curated collection of resources will help you find packages and learning resources to help you on your R journey.
Learn to purrr
Learn the basics of the purrr package in R, which is part of the tidyverse and is used for iteration and manipulating lists.
Go to Resource
Learning R as a SAS user
This article provides valuable resources and tips for learners transitioning from SAS to R. It introduces the Sassy system of packages, which mimics familiar SAS outputs, and offers links to useful cheatsheets and videos for R learners. The author acknowledges the unique challenges faced by former SAS users and organizes tips from data loading to execution advice, catering to various skill levels. The article aims to ease the learning curve and enhance the R programming experience for individuals accustomed to SAS.
Go to Resource

Learning tidyselect
Learning tidyselect is a tutorial that covers various aspects of working with multiple columns using tidyselect in R. It explains the tidyselect selection helpers and how to use them with select(), where() and across(). It also provides examples and exercises to practice the concepts.
Go to Resource
Let's talk about joins
This blog post by Crystal Lewis delves into data joins, a fundamental process in data analysis when dealing with multiple datasets. The author clarifies horizontal and vertical joining methods, providing examples and explaining the nuances of left, right, full, and inner joins. Lewis emphasizes considering the type of join for specific research purposes and offers guidance on performing these operations, particularly in R, though the concepts apply across various programming languages. Importantly, the post outlines rules regarding variable naming and keys which are crucial for successful data merging.
Go to Resource
Let's talk about joins
This content provides a tutorial by Crystal Lewis on how to perform joins in data analysis, both horizontal and vertical, using SQL, R, Stata, SAS, or other programs. It explains different types of joins such as left, right, full, and inner joins, and the scenarios in which they might be used, like linking data across instruments, time, or participants. Lewis further details two important rules for horizontal joins related to variable naming and keys, ensuring the proper merging of datasets without duplication or data loss.
Go to Resource
Leveraging labelled data in R
This blog post discusses how to leverage labelled data in R using the haven, labelled, and sjlabelled packages. It covers importing labelled data, creating a data dictionary, identifying labelled features, and common operations with labelled data. The post also provides an example and mentions other packages and workflow for labelled data manipulation.
Go to Resource
Listening to complex tones using sine waves and toneR
The post details an experiment with auditory perception by converting chord patterns into complex tones through programming. Matt Crump describes using the R package {toneR} to synthesize chords as sums of sine waves at varying frequencies and amplitudes, resulting in complex tonal renderings. Initial code examples involve AI model 'Dreamshaper' generating art from prompts, with a musical focus. Subsequently, the tutorial shifts to R code for audio synthesis and processing. This exploration rekindles the author's previous academic work on complex tones and their perceptual effects, inviting readers to join in the auditory experiment.
Go to Resource
Look at your objects
The content discusses various methods to 'check in' on intermediate R objects during data analysis, emphasizing good practice for understanding data at each step. The author examines classic printing to the console, the use of semicolons, parenthesis for immediate output, inspecting data within pipelines, and summary functions like `glimpse()` that continue the pipeline. The post critiques each method's practicality, such as the cumbersomeness of multiline code or missing pipe symbols, and recommends best practices for students and analysts to monitor their data at different stages of analysis, using functions from libraries like tidyverse and magrittr.
Go to Resource
Lots is happening in the LLM/R space!
Veerle Eeftink - van Leemput discusses the rapid development of R and LLM-related software, detailing new packages and tools that integrate Large Language Models (LLMs) with R. She highlights packages that facilitate API calls, context-aware assistance, and NLP tasks without training custom models. Notable contributions from Simon P. Couch and other developers are mentioned, including tools for evaluating LLM performance, error handling, unit testing, and sentiment analysis. The post hints at R's vitality in the LLM ecosystem and includes links to GitHub repositories for further exploration.
Go to Resource
Maker of RStudio launches new R and Python IDE
Posit, previously known as RStudio, released a beta version of its new integrated development environment (IDE) called Positron. Tailored for data science, Positron supports both R and Python programming languages and is based on Visual Studio Code. It simplifies setup for R and Python without needing additional extensions, unlike standard VS Code. Positron includes built-in features like a data explorer for viewing and interacting with data frames. It is available on macOS, Windows, and Linux and integrates with the OpenVSX registry for extensions, highlighting Posit's support for OpenVSX. The IDE emphasizes a code-first approach with additional tools to aid data examination.
Go to Resource
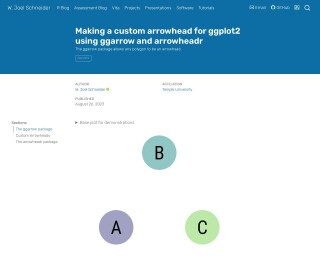
Making a custom arrowhead for ggplot2 using {ggarrow} and {arrowheadr}
This content appears to be a snippet demonstrating how to use the ggarrow package in R to create custom arrow geoms in ggplot2. It shows code examples for generating plots with different types of arrows, like open arrows, closed arrows, latex' arrows similar to TikZ, sharp barbs, feathers, kite arrowheads, and more. It includes instructions on how to adjust the arrow properties such as angle, length, sharpness, and resection. The text also compares the ggplot2 default arrows with those available in TikZ and emphasizes the flexibility provided by the ggarrow package.
Go to Resource
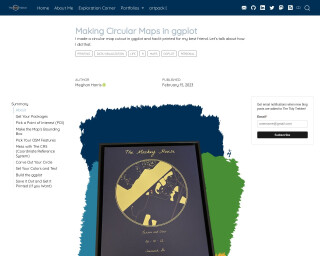
Making Circular Maps in ggplot
Meggan Harris wrote a blog post on how to create circular maps using R and ggplot2. The post describes the experience of the author as she traveled extensively in 2022 and decided to create a personalized wedding gift map for her friend. The post details the necessary R packages, picking a point of interest, and how to obtain latitude and longitude points for mapping. The author also shares code snippets for creating maps with simple features and making them look pleasing with special fonts and aesthetics. The code for the project is shared on GitHub for those who want to skip the reading.
Go to Resource