
Resources
This carefully curated collection of resources will help you find packages and learning resources to help you on your R journey.
Making Middle Earth maps with R | Andrew Heiss
Andrew Heiss shares his experience in creating Middle-Earth maps using R in this educational blog post. He introduces readers to the {sf} package and demonstrates how to work with shapefiles for GIS-related visualization in {ggplot2}. Heiss, a fan of J. R. R. Tolkien, merges his expertise in data visualization with his love for Tolkien's world, offering a fun approach to learning spatial data manipulation and visualization techniques. He provides a beginner-friendly explanation of geographic data concepts and guides readers through the process of creating maps with R, using shapefiles of Middle Earth as a case study.
Go to Resource
Making Middle Earth maps with R | Andrew Heiss
This blog post by Andrew Heiss provides a tutorial on how to make Middle Earth maps using R and ggplot. It covers the use of the sf package for working with geographic data and shapefiles, as well as demonstrating data visualization tricks.
Go to Resource
Making Pretty PDFs with Typst (and Quarto)
Nicola Rennie's article explores the benefits of the new Typst system for creating PDFs with Quarto. Typst is an alternative to LaTeX that aims to be easier to learn and more user-friendly. The article provides a guide on how to use Typst with Quarto, including setting the formatting and creating custom styles. It addresses the challenges of learning Typst by sharing personal experiences and comparing code snippets between Typst and LaTeX. The focus is on enhancing the appearance of PDF documents while maintaining reproducibility and control over the formatting.
Go to Resource
Mapping Antarctica
The blog post 'Mapping Antarctica' outlines the process of creating clean orthographic maps of Antarctica in R, overcoming challenges presented by polar projections and the International Date Line. The author provides a detailed tutorial to manually correct the GISCO Antarctica shapefile and eliminate projection artifacts. Using R libraries such as tidyverse, sf, and giscoR, the post guides readers through identifying and fixing geometry issues, ultimately producing a refined and accurate map visualizing the Antarctic territory.
Go to Resource
Mapping building use with a hexagonal grid
Dr. Dominic Royé demonstrates how to visualize building use distribution across Spain via a 20 km hexagonal grid. The process involves aggregating 100 m building-use rasters into hexagons, to depict land use like agricultural, industrial, and commercial purposes. Hexagons are chosen for spatial analysis to minimize directional bias and improve pattern recognition. The tutorial includes R code, using packages like terra, sf, and tidyverse, to manipulate the data and visualize the grid, with a focus on a cleaner, clutter-free presentation, and includes data from a 2023 paper for in-depth reference.
Go to Resource
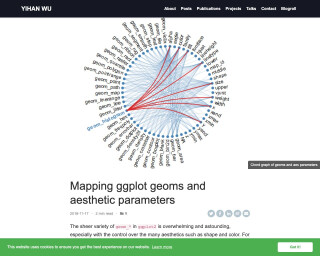
Mapping ggplot geoms and aesthetic properties
A blog post by Yihan Wu about mapping ggplot geoms and aesthetic parameters using the ggplot2 package in R.
Go to Resource
Mapping water insecurity in R with tidycensus
This content provides a comprehensive guide on utilizing the tidycensus package in R to map water insecurity based on American Community Survey data. It elaborates on setting up the tidycensus environment, exploring Census Bureau variables, and performing data processing. Techniques like data visualization with tigris and sf packages are also covered. The tutorial highlights differences in plumbing facilities and compares population versus plumbing access across Western U.S. counties. With practical code examples, it aids readers in understanding and visualizing the spatial variation of social vulnerability indicators affecting water insecurity.
Go to Resource

Mastering Shiny
This is the online version of Mastering Shiny, a book under development, that teaches how to create web applications using R code with the Shiny framework. It covers the basics of Shiny and provides techniques to solve common app challenges. The book aims to make readers expert developers of large, complex, maintainable, and performant Shiny apps.
Go to Resource

Meet xaringan: making slides in RMarkdown
This is a tutorial on how to make slides with R Markdown using the xaringan package.
Go to Resource
Miriam Lerma: Add text on images using R
This article explains how to add text to images in R and merge two images using the {magick} package. It covers installation and usage of the package, selecting the working directory, and loading images with 'image_read'. The article demonstrates how to annotate images with text at specific locations and export the modified images using 'image_write'. Additionally, it shows how to add a border to images and combine them side by side into a single image before exporting. The guide includes code snippets and is suitable for those looking to edit images programmatically in R without image compression issues.
Go to Resource
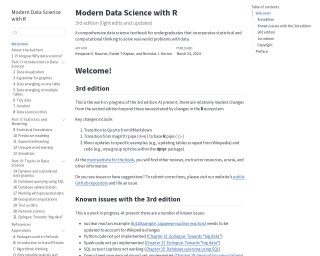
Modern Data Science with R
Modern Data Science with R (3rd edition) is a comprehensive textbook for undergraduate students that blends statistical and computational methods to solve real-world data problems. Authored by Baumer, Kaplan, and Horton, the update reflects changes in the R ecosystem, including a shift to Quarto from RMarkdown and base R's pipe operator. While introducing minor example and code updates, the edition is a work-in-progress with certain sections pending completion, such as Python and Spark integration, and geospatial computations. It serves as a resourceful guide for aspiring data scientists seeking to harness the power of R.
Go to Resource

Modern Data Visualization with R
Modern Data Visualization with R by Robert Kabacoff is a comprehensive guide for creating a wide array of visualizations using R, specifically with the ggplot2 package. The online version, slated for print by CRC Press and Amazon, covers data import, cleaning, and preparation followed by an in-depth exploration of various graph types such as univariate, bivariate, and multivariate graphs. It also delves into topics like mapping, time-dependent graphs, statistical models, and customization of plots. Interactive graphs and best practices in data visualization are discussed to enhance the reader's graphing skills.
Go to Resource