
Resources
This carefully curated collection of resources will help you find packages and learning resources to help you on your R journey.
A quick tour of Positron
The content is an introduction to Positron, a free data science IDE that supports both R and Python. Built as a fork of VS Code, Positron offers features such as a built-in data explorer, AI assistance, and interpreter management, facilitating a streamlined workflow for data professionals. The blog outlines key components like the Activity Bar, Editor, and Panels for navigation. It also provides a guide to managing interpreters, using the Data Explorer, database connections, Positron Assistant for AI-powered code generation, and accessing documentation. The post serves as an invitation to download and explore Positron.
Go to Resource

A Scientist's Guide to R: Step 1. Getting Data into R
A tutorial on getting data into R, covering various file formats like .csv, .txt, .xlsx, etc.
Go to Resource

A Scientist's Guide to R: Step 2.1. Data Transformation - Part 1
This post is part of the Scientist's Guide to R series and focuses on data transformation techniques for wrangling, tidying, and cleaning data. It introduces the core functions of the dplyr package, as well as other relevant functions in base R. The post covers topics such as selecting columns, filtering rows, modifying columns, obtaining descriptive summaries of data, assigning grouping structures, and arranging data frames. The post also mentions the data.table package for working with large datasets. The examples in the post demonstrate how to use the select() function from the dplyr package to subset columns from a data frame.
Go to Resource

A Scientist's Guide to R: Step 2.2 - Joining Data with dplyr
This post is part of the Scientist's Guide to R series and focuses on using joins to combine data frames in R with the dplyr package. It covers different types of joins, such as inner, left, right, full, semi, and anti join, as well as using bind_rows() or bind_cols() to build data frames. The post also mentions the merge() function in base R for joining data frames.
Go to Resource

A Scientist's Guide to R: Step 2.3 - string manipulation and regex
A Scientist's Guide to R: Step 2.3 - string manipulation and regex
Go to Resource
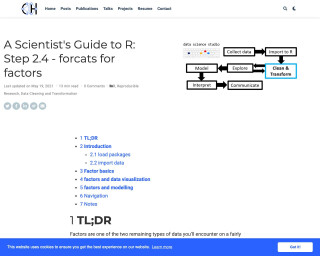
A Scientist's Guide to R: Step 2.4 - forcats for factors
This post is part of a series called A Scientist's Guide to R and focuses on how to work with factors in R using the forcats package.
Go to Resource
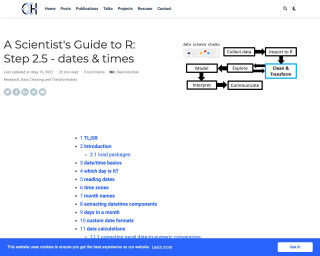
A Scientist's Guide to R: Step 2.5 - dates & times
A Scientist's Guide to R: Step 2.5 - dates & times is a blog post that provides a guide on how to work with dates and times in R using the lubridate package. It covers topics such as date/time basics, reading dates, time zones, month names, extracting datetime components, custom date formats, date calculations, and planning a behavioural neuroscience experiment. The post aims to help readers handle dates and times effectively in R.
Go to Resource
A SIMPLE guide to create BUMP CHARTS with ggplot2 - YouTube
A YouTube tutorial on creating bump charts with ggplot2
Go to Resource

A timeline of R's first 30 years
This content celebrates the 30th anniversary of the R language with a timeline highlighting significant milestones, packages, and papers. Developed by Tim Brock, Colin Gillespie, and the Jumping Rivers Team, it showcases R's evolution and invites contributions through social media. The standalone timeline is inspired by a figure in a publication on R's role in bioinformatics and data science. Jumping Rivers offers related training and a newsletter.
Go to Resource
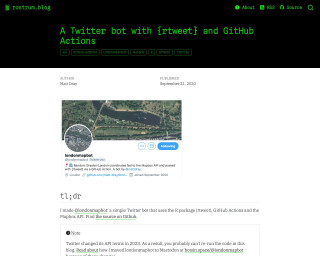
A Twitter bot with {rtweet} and GitHub Actions
A blog post about creating a Twitter bot using the R package rtweet and GitHub Actions
Go to Resource
A year with Visible Long-Covid Tracking
Dr. Mowinckel shares insights on a year-long journey of tracking Long Covid symptoms using the Visible app. The app monitors heart rate, HRV, daily symptoms, and functional capacity through the FUNCAP27 questionnaire. The post details the process of collecting and analyzing personal health data to understand recovery patterns, pacing strategies, and warning signs. The blog also offers a look at tools within Visible that help visualize progress, such as heart rate graphs and a functional capacity semi-circle, providing a valuable resource for individuals managing Long Covid.
Go to Resource
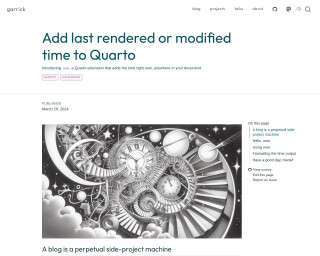
Add last rendered or modified time to Quarto
Garrick Aden-Buie's blog post introduces 'now,' a Quarto extension that allows the automatic update of time information in Quarto documents. This extension saves time by eliminating the need for manual updates of dates in documentation footers. By adding the extension using 'quarto add gadenbuie/quarto-now,' Quarto users can employ shortcodes like '{{< now >}}' and '{{< modified >}}' to display the current or last modified time. The extension supports customization of time output formats and may significantly streamline Quarto project maintenance by ensuring date accuracy without manual intervention.
Go to Resource