
Resources
This carefully curated collection of resources will help you find packages and learning resources to help you on your R journey.
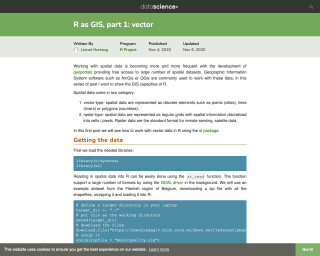
R as GIS, Part 1
This post is part of a series that explores the GIS capabilities of R, focusing on working with vector spatial data using the `sf` package. It covers topics such as loading spatial data, manipulating sf objects using dplyr functions, and working with coordinate reference systems.
Go to Resource
R Best Practices
This post provides a discussion of best practices for developing code-based projects and for writing R code in a research setting with an eye toward proactively avoiding common pitfalls.
Go to Resource
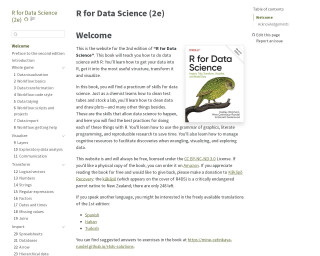
R for Data Science (2e)
R for Data Science (2e) is a comprehensive guide to performing data science tasks with R. It covers how to import, structure, transform, and visualize data while teaching best practices in data cleaning, plotting, and more. The book promotes literate programming and reproducible research to streamline work. It supports cognitive resource management for data wrangling and exploration. The content is freely available under the CC BY-NC-ND 3.0 License, with an option to support kākāpō conservation. Physical copies can be ordered on Amazon, and solutions to exercises are provided online.
Go to Resource

R for Data Science, Chapter 16: Dates and Times
This chapter in the R for Data Science book provides an introduction to working with dates and times in R. It covers topics such as creating date/times, parsing strings into date/time objects, and working with date/time components. The chapter also introduces the 'lubridate' package, which makes it easier to work with dates and times in R.
Go to Resource

R for Data Science: Chapter 21: Iteration
This text is a part of the book 'R for Data Science' and provides an introduction to iteration in R. It covers the benefits of reducing code duplication, the use of functions and iteration to achieve this, and introduces the concepts of imperative programming and functional programming. It also provides examples of using for loops to compute the median of each column in a dataframe.
Go to Resource
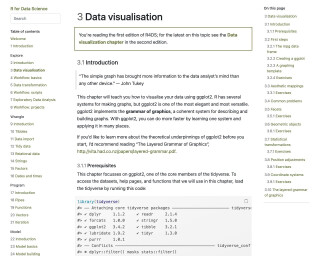
R for Data Science: Chapter 3: Data Visualization
This chapter teaches you how to visualize your data using ggplot2 in R. It covers the basics of creating different types of plots and customizing them.
Go to Resource

R for Excel Users: GitHub
This is a GitHub tutorial for R users who are familiar with Excel. It covers topics such as RStudio, RMarkdown, GitHub, ggplot2, dplyr, and tidying data.
Go to Resource
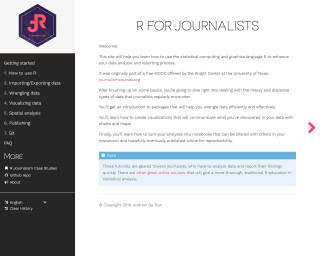
R for Journalists
This is a resource for journalists to learn how to use the R programming language for data analysis and reporting. It covers topics such as installing R and RStudio, importing/exporting data, data wrangling, data visualization, spatial analysis, publishing with RMarkdown, and using Git for version control. The tutorials are designed to help journalists quickly analyze data and report their findings.
Go to Resource

R for Sign Language Linguistics
A short tutorial on using R for sign language linguistics
Go to Resource
R for Sign Language Linguistics
This content is a tutorial by Carl "Calle" B{"o}rstell on leveraging R for sign language linguistics, published on August 17, 2023. It targets sign language linguists who are familiar with R, mentioning helpful resources and focusing on handling ELAN files (.eaf) using the {tidyverse} and custom functions in R. The tutorial introduces the {signglossR} package and the read_elan() function for importing ELAN files into R for data analysis, and details steps for reading, storing, and pivoting ELAN annotation data into wide format, with examples provided.
Go to Resource
R Graph Gallery
The R Graph Gallery is a collection of charts made with the R programming language. It features a wide range of chart types and provides reproducible code and explanations for each example. The gallery focuses on the tidyverse and ggplot2 packages. It also showcases the best R charts created by leading creators in the field.
Go to Resource
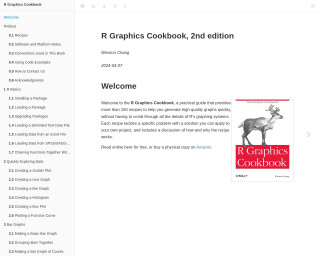
R Graphics Cookbook
The R Graphics Cookbook is a practical guide that provides more than 150 recipes to help you create high-quality graphics in R. This second edition of the book covers various topics such as data exploration, bar graphs, line graphs, scatter plots, and more. Each recipe provides a problem, a solution, and a discussion of the code, allowing you to learn and understand the concepts behind creating effective graphics.
Go to Resource