
Resources
This carefully curated collection of resources will help you find packages and learning resources to help you on your R journey.
Short R commands and tricks
This content provides a detailed guide on embedding plots within another plot in R, and enhancing plot titles with colors to eliminate legends for maximizing real estate. The steps involve creating base and embedded plots using libraries like 'tidyverse' and 'mdthemes', and then incorporating the embedded plot with 'annotation_custom()'. It also discusses adding colored titles to plots without legends using 'ggtext' and HTML rendering. The guide includes code examples with libraries such as 'ggplot2' and 'palmerpenguins' to demonstrate the tricks in practice, making data visualization neater and more efficient.
Go to Resource
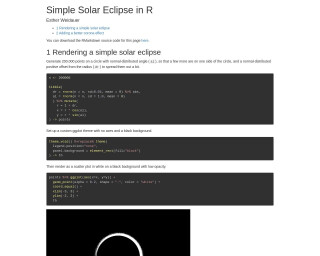
Simple Solar Eclipse in R
The tutorial 'Simple Solar Eclipse in R' by Esther Weidauer explains how to render a simple solar eclipse using R and ggplot2. It begins with generating points on a circle to simulate the moon's disk and then proceeds to add a corona effect, simulating the sun's atmosphere seen during an eclipse. Adjustments are made for a more realistic corona by creating subsets of points, assigning unique identifiers, and layering to produce the final visual effect. RMarkdown for the demo is available for download, encouraging users to try their hand at this elegant astronomical depiction.
Go to Resource
Slidecrafting
Slidecrafting is a guide by Emil Hvitfeldt on creating functional and aesthetically pleasing slides using Quarto presentations. Published on September 24, 2025, the book emphasizes the art of slidecrafting, with advice applicable to various slide technologies. It offers readers knowledge on theming, content layout, and interactivity in slides, alongside SCSS tips and extensions. The book aims to aid readers in developing their style while ensuring the constant elements of presentations are refined, suggesting the use of Quarto's reveal.js documentation for mastery.
Go to Resource
Solving iteration problems with purrr
Video tutorial from the useR! International R User 2017 Conference about solving iteration problems with purrr.
Go to Resource
Some good practices for research with R
The article discusses best practices for conducting research with R, covering data validation with the {validate} package, ensuring reproducibility with {renv}, and using {here} for reproducible paths. It explains how to validate data by defining rules and confronting datasets with expectations, providing examples with code snippets. Moreover, it emphasizes the importance of package management for reproducibility, cautioning against the risks of evolving or unsupported packages and offering solutions like package snapshots with {renv}. It is aimed at R users conducting research who seek to avoid errors and ensure consistent results over time.
Go to Resource
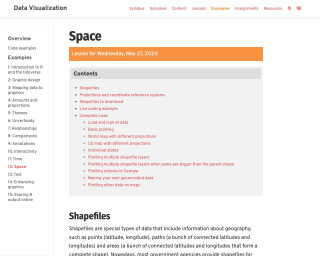
Space lesson from Data Visualization course
This resource is a lesson on using shapefiles for data visualization in R. It covers topics such as shapefile projections and coordinate reference systems, loading and plotting shapefiles, and plotting other data on maps.
Go to Resource
Spatial Data Science
The book provides an introduction to spatial data analysis and visualization in R. It covers basic concepts and techniques for working with spatial data, including data import/export, data manipulation, spatial visualization, spatial statistics, and spatial modeling.
Go to Resource
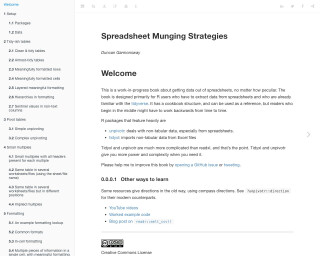
Spreadsheet Munging Strategies
This is a work-in-progress book about getting data out of spreadsheets, no matter how peculiar. It is designed for R users who have to extract data from spreadsheets and who are already familiar with the tidyverse. It has a cookbook structure, and can be used as a reference.
Go to Resource
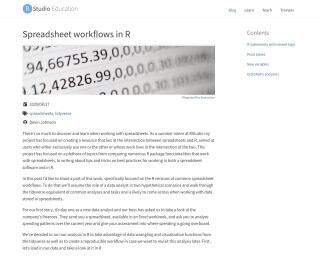
Spreadsheet workflows in R
A resource that focuses on the intersection of spreadsheets and R, providing tips and tricks on best practices for working with both. It covers the R versions of common spreadsheet workflows, such as data wrangling and visualization.
Go to Resource
Stacked line chart
This post details how to create a polished stacked area chart in R using ggplot2, tidyverse, and additional packages. Geared toward publication, the chart features inline labels, a visually appealing color scheme, and a professional title and footer. It showcases Gilbert Fontana's work and provides a step-by-step guide starting from loading necessary libraries, like ggstream for smooth shapes and showtext for custom fonts, to loading data directly from Excel with readxl. The tutorial explains basic chart creation, smoothing lines, color scaling, custom font usage, and includes the code to produce the chart.
Go to Resource
Stacked line chart with inline labels – the R Graph Gallery
This post shows how to build a clean stacked area chart using R, ggplot2 and the tidyverse.
Go to Resource

Stat545
This is the table of contents for the STAT 545 resource, which covers various topics related to R programming.
Go to Resource