
Resources
This carefully curated collection of resources will help you find packages and learning resources to help you on your R journey.


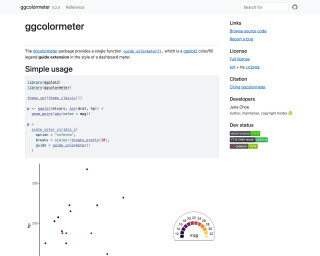
Colormeter Guide Extension • ggcolormeter
The ggcolormeter package provides a single function guide_colormeter() which is a ggplot2 color/fill legend guide extension in the style of a dashboard meter.
Go to Resource
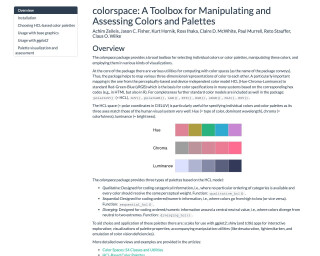
colorspace: A Toolbox for Manipulating and Assessing Colors and Palettes
colorspace is a toolbox for manipulating and assessing colors and palettes in the R language. It provides utilities for computing with color spaces, such as converting between different color models. The package also includes predefined color palettes and functions for creating customized palettes. It can be used for visualizations and choosing colors in data analysis and graphic design.
Go to Resource
Compute and Visualize Wildfire Exposure • fireexposuR
fireexposuR is an R package designed for computing and visualizing wildfire exposure with a focus on aiding wildfire management. It automates established methodologies, offers customization for various use cases and geographies, and enables output visualization. Users from varied sectors like research, government, and forestry can benefit, but a solid understanding of wildland fuels, spatial data, and R is recommended. The package ensures accessibility and encourages users to familiarize themselves with the underpinning scientific theories for effective use. It doesn't simplify the complexities of theory, data preparation, or parameter decision-making intrinsic to wildfire exposure assessments.
Go to Resource
Convenience Functions for Working With Non-Calendar Years in R • acadyr
acadyr is an R package that simplifies the process of working with financial and academic years, which do not follow standard calendar cycles. It provides utility functions to create and manipulate these non-standard year types in R, such as financial_year and academic_year, which help in determining the year based on any given date. The package integrates smoothly with dplyr and ggplot2, and includes a vignette with examples of typical use cases, such as generating summary bar charts of revenues by financial year. While not available from CRAN, acadyr can be installed directly from GitHub.
Go to Resource

covdata
covdata is a data package for R that collects and bundles datasets related to the COVID-19 pandemic from a variety of sources.
Go to Resource
cowplot
The cowplot package provides various features that help with creating publication-quality figures, such as a set of themes, functions to align plots and arrange them into complex compound figures, and functions that make it easy to annotate plots and or mix plots with images.
Go to Resource
CRAN - Package ggquiver
An extension of 'ggplot2' to provide quiver plots to visualise vector fields.
Go to Resource
Create Interactive Gantt Charts with Work Breakdown Structure • ganttify
Ganttify is a package that allows for the creation of interactive Primavera-style Gantt charts with a Work Breakdown Structure (WBS) hierarchy. Leveraging plotly, the package enables flexible and dynamic visualizations with features such as multi-level WBS organization, flexible coloring, interactive elements, dynamic date formatting, scrollable views, milestone lines, and options for dimming past activities. Users can show/hide WBS, customize labels, and compare planned vs actual dates. It offers an organized configuration API for cleaner code and is available on CRAN and GitHub.
Go to Resource
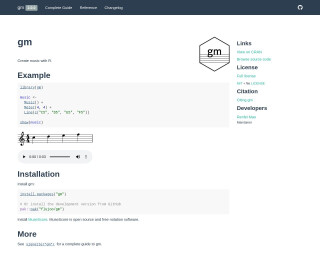
Create Music with R
The 'gm' package in R enables users to create music by programmatically defining musical elements such as meter and musical lines. It offers an ease of composing music within R. Using functions like 'Music()', 'Meter()', and 'Line()', users can construct and visualize melodies. The package is easily installable from CRAN or GitHub for the development version. Integration with MuseScore, a free notation software, allows for a seamless music notation experience. The 'gm' package is open-source under the MIT license, with detailed documentation available in its vignette.
Go to Resource
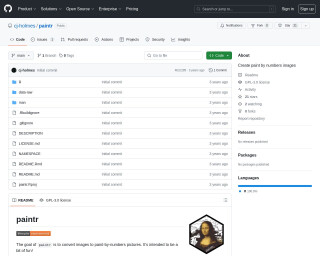
Create paint by numbers images
The 'paintr' GitHub repository hosts an R package for creating paint-by-numbers images. It leverages the 'magick' package for image processing and color picking, and 'sf' and 'rmapshaper' packages for handling image polygons. Users can apply noise reduction, smoothing, and polygon simplification to adjust the image feel. It also allows for custom color palettes. The repository contains examples, including usage with Hadley Wickham's photo, demonstrating how to generate a paint-by-numbers result and apply different palettes for the desired artistic effect.
Go to Resource