
Resources
This carefully curated collection of resources will help you find packages and learning resources to help you on your R journey.

Adding a logo to images with {magick} and {purrr}
Jadey Ryan shared her experience with automating the process of adding logos to images using the R packages {magick} and {purrr}. She also highlighted new merchandise such as tote bags and embroidered hats on her Etsy shop. Additionally, she announced a free webinar series on soil health where she will demo the {soils} R package. Alongside, she informed about the Parameterized Quarto workshops she is giving, focusing on efficient report generation using R and Quarto, with the next one scheduled with R-Ladies Abuja.
Go to Resource
Adding alt text to figures in quarto with Claude Code
The blog post describes a new workflow for adding alternative (alt) text to figures in Quarto documents, leveraging Claude Code, to make the process less tedious and more manageable. It emphasizes the importance of thoughtful alt text creation, details how Quarto's features can be used to extract figure details, and introduces a custom slash command for Claude Code to assist in writing alt text. This command uses Amy Cesal's formula, combining chart type, data description, and key insight into the alt text, utilizing source code and prose context for accurate and informative descriptions.
Go to Resource
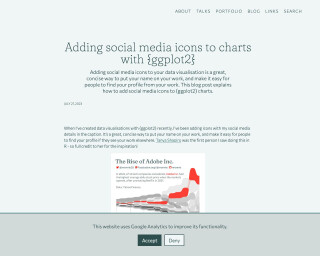
Adding social media icons to charts with {ggplot2}
Adding social media icons to charts with {ggplot2}
Go to Resource

Advanced Reproducible Research in R
This content covers an advanced workshop titled 'Advanced Reproducible Research in R,' designed to teach collaborative and automated analysis pipelines in scientific research. It emphasizes the importance of reproducibility and open scientific practices, presenting solutions to challenges such as coding standards, software dependency documentation, and data analysis automation. The course uses a code-along format with real-world datasets, created with Quarto, GitHub, and GitHub Actions. The material is available on a website and the r-cubed-advanced GitHub repository, licensed under Creative Commons for open use and modification.
Go to Resource
Age Disparity in Shelter Cost per Room
This content details a study on shelter cost per room over time in various regions and age groups in Canada, using Census data as a proxy for housing size. The authors, von Bergmann and Lauster, investigate the increasing shelter costs, particularly for younger people and in areas with housing shortages. They compare these costs with UK statistics on shelter cost per square meter by age and explore the limitations and benefits of using the number of rooms as a metric for household space and costs. The analysis includes data-wrangling using tidyverse and custom functions in R.
Go to Resource
AI capabilities built into Positron
Recorded at posit::conf(2025), this demo showcases practical ways to use the Positron Assistant for tasks like debugging code, generating visualizations, and even creating entire Quarto reports. It also introduces Databot, an experimental agent for exploratory data analysis, demonstrating how these tools can accelerate your workflow while keeping you in the driver’s seat.information, advertising opportunities, and terms of service. It also includes a nod to privacy and safety principles and the operational workings of YouTube. Additionally, it promotes YouTube's experimentation with new features and the service NFL Sunday Ticket. The 2025 copyright date suggests forward-looking engagement with these matters. The content outlines multiple facets of YouTube's online presence and user interface.
Go to Resource
AI-Assisted Clinical Dashboard Development
This article showcases the development of a Clinical Dashboard Prototype using AI-assisted tools within a constrained 48-hour period. The development team faces the challenge of creating a functional PK/PD simulation platform for a stakeholder meeting without enough time for traditional development cycles. By leveraging AI tools like Claude Code, V0.dev, and others, they demonstrate the acceleration of dashboard development. The focus is on the interplay of AI tools to achieve functionality and user experience, reflecting on the strengths and limitations of each tool in the process.
Go to Resource
AI-Powered Data Science in Positron
Positron is a new, free AI-powered code editor by Posit for R and Python, featuring agentic AI capabilities. It was demonstrated by Ryan Johnson, a Data Science Advisor at Posit PBC, who emphasized the tool's ability to simplify data science workflows while keeping the experts in control. Positron is designed to automate tedious tasks, and this demonstration on October 29, 2025 will showcase how AI can enhance productivity without taking over the expert’s role.
Go to Resource
Albert Rapp - Creating interactive visualizations with {ggiraph} (with or without Shiny)
Creating interactive visualizations with ggiraph (with or without Shiny)
Go to Resource

Albert Rapp - Four reasons to learn HTML + CSS as an R programmer
Four reasons to learn HTML + CSS as an R programmer
Go to Resource
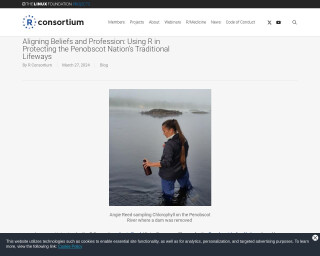
Aligning Beliefs and Profession: Using R in Protecting the Penobscot Nation's Traditional Lifeways
In an interview, Angie Reed, Water Resources Planner for the Penobscot Indian Nation, shares her journey with R, from statistics to river conservation. Beginning with the Houlton Band of Maliseet Indians and later joining the Penobscot Indian Nation, she uses R to blend traditional views with modern technology. This enables engaging community involvement and environmental protection. Her work involves river stewardship, education in R coding, and development of an interactive R Shiny app for the local community, underscoring how R can be instrumental in preserving traditional lifeways and promoting sustainability.
Go to Resource
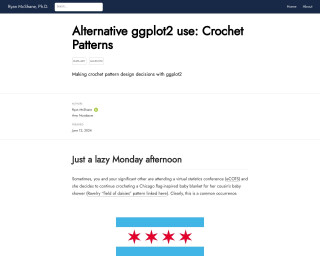
Alternative ggplot2 use: Crochet Patterns
Ryan McShane, Ph.D. demonstrates an unconventional use of ggplot2 to aid in crochet pattern design decisions. While attending a virtual statistics conference, McShane's partner works on a Chicago flag-inspired crochet baby blanket. To assist with visualizing the design, McShane employs ggplot2 to represent different pattern possibilities for the granny square arrangement, effectively combining data visualization with crafting. The article includes code snippets and detailed explanations on how to implement this creative application of ggplot2, turning a statistical tool into an artistic aid.
Go to Resource