
Resources
This carefully curated collection of resources will help you find packages and learning resources to help you on your R journey.
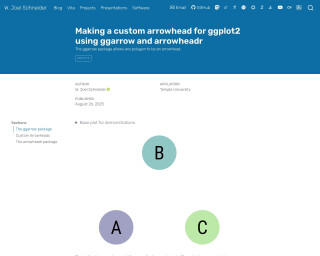
W. Joel Schneider
This text demonstrates the usage of arrow geometries in ggplot2 for creating custom arrowheads.
Go to Resource
Welcome to ModernDive (v2) | Statistical Inference via Data Science
ModernDive (v2) is the website for 'Statistical Inference via Data Science: A ModernDive into R and the Tidyverse (Second Edition)'. It showcases updates from the first edition, which is available online and for purchase. The book, authored by Chester Ismay, Albert Y. Kim, and Arturo Valdivia, teaches R and data science concepts. It's scheduled for print by CRC Press in 2025 and is licensed under Creative Commons. Readers can contribute on GitHub and anticipate a resource-rich approach to stats with a focus on tidyverse tools for data analysis.
Go to Resource
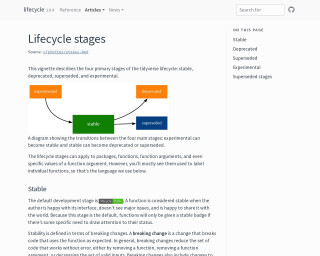
What does deprecated mean? Package lifecycle and the process of deprecation
This content describes the lifecycle stages of the tidyverse ecosystem, including stable, deprecated, superseded, and experimental stages, mainly as they apply to functions. It outlines how the stages affect the usability and changes in functions, with a focus on preventing and managing breaking changes. Emphasis is placed on ensuring code robustness by careful use of functions according to their intended effects. The content also addresses the gradual deprecation process, which provides warnings and guidance for replacing outdated functions, and introduces the 'lifecycle' package for managing these transitions.
Go to Resource
What does deprecated mean? Package lifecycle and the process of deprecation. - YouTube
This YouTube video provides an explanation of the meaning of 'deprecated' and discusses the package lifecycle and the process of deprecation.
Go to Resource
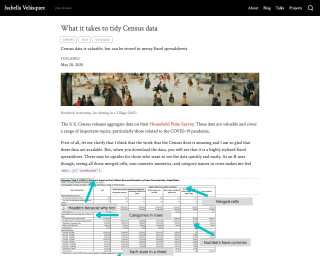
What is Takes to Tidy Census Data
This article explains the process of tidying Census data using R and tidyverse packages.
Go to Resource
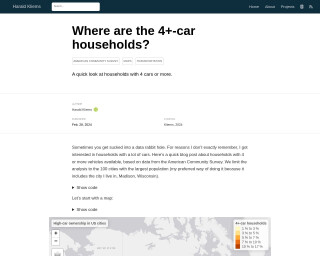
Where are the 4+-car households?
Harald Kliems investigates the prevalence of 4+-car households in the 100 most populous US cities using data from the American Community Survey. The blog post highlights the spatial distribution of such households and contrasts the top and bottom ten cities in terms of the percentage of 4+-car ownership. Key R packages used in the analysis include tidyverse, tidycensus, tigris, gt, and tmap. This examination into the facets of American car ownership is accompanied by visualizations such as maps and tables, enabling deeper insights into the data.
Go to Resource
Which names that are also names of countries are most common?
Simon P. Couch's blog post investigates which names that are also names of countries are most popular in the United States from 1880 to 2017. The post details the process of using R and packages like 'babynames' and 'countrycode' to filter and analyze baby name data. It offers a glimpse into the results, revealing the top country-names and their trends over time. Readers are encouraged to guess the most common names before seeing the data-driven answer. The post concludes with interesting visualizations showing the historical trends for the top country-names.
Go to Resource
Why R? Webinar 037 - D. Gohel - Tabular reporting with the flextable package - YouTube
This is a webinar titled 'Tabular reporting with the flextable package' by D. Gohel. It is a part of the 'Why R?' webinar series and is available on YouTube.
Go to Resource
Working with categorical data in R without losing your mind
Working with categorical data in R without losing your mind - This talk outlines common problems arising from categorical variable transformations in R, and shows strategies to avoid them, using both base R and the Tidyverse.
Go to Resource
Working with colours in R
This blog post by Nicola Rennie guides readers on effectively using colors in R for data visualization or generative art. It discusses various methods to define colors, choosing suitable color palettes, and generating custom color schemes, without delving deeply into plot implementation. A useful 'plot_palette()' function is provided with examples. Readers learn about color names, hex codes, and RGB values, and how to apply them in R, with references to further resources.
Go to Resource

Working with Strings in R: Seattle Pet Names
This is a tutorial on how to work with strings in R using the 'stringr' package and the 'rebus' package. The tutorial uses the 'Seattle Pet Names' dataset from TidyTuesday and focuses on the names given to cats and dogs. It demonstrates the manipulation of strings by removing punctuation and excess white space from the names.
Go to Resource
Wrangling categorical data in R
This tutorial is a comprehensive guide on how to wrangle categorical data in R. It covers various techniques and functions to manipulate and analyze categorical data, including recoding, reordering, and summarizing categorical variables. The tutorial also provides step-by-step examples and case studies to illustrate the concepts.
Go to Resource