
Resources
This carefully curated collection of resources will help you find packages and learning resources to help you on your R journey.
Create Sankey and Alluvial Diagrams Using ggplot2 • ggsankeyfier
The ggsankeyfier package enhances ggplot2 by allowing the creation of Sankey and Alluvial diagrams, which are types of data visualization that depict the flow of quantities through stages or categories. It provides specialized functions to handle the complex layout of these diagrams, including the ability to model skipped stages or feedback loops. The package defines its own terms for consistency and offers a thesaurus for commonly used Sankey terminology. It can be installed from CRAN or GitHub and is integrated into the ggplot2 workflow, requiring structured data for plotting.
Go to Resource
Creating messy datasets for teaching purposes with {truffle}
The {truffle} R package, designed by Ian Hussey for educational purposes, helps users learn data processing by generating 'messy' datasets. It provides tools to create both 'truffles'—deliberate known effects to be uncovered—and 'dirt'—intentional complications that resemble common data issues. The package allows customization of demographics and Likert-scale items, and embeds effects such as group differences, correlations, and specific reliability coefficients. However, {truffle} has limitations in flexibility, error handling, and study design scope. It is compared with other R packages like {lavaan}, {latent2likert}, and {wakefield}, highlighting its unique focus on creating challenging datasets for data-wrangling education.
Go to Resource

data.table
data.table provides a high-performance version of base R’s data.frame with syntax and feature enhancements for ease of use, convenience and programming speed.
Go to Resource

DBI
The DBI package helps connecting R to database management systems (DBMS). It separates the connectivity to the DBMS into a “front-end” and a “back-end” and provides an interface that is implemented by different DBI backends. The package supports operations like connecting to a DBMS, executing statements, extracting results, and handling errors. The DBI package is typically installed automatically when you install one of the supported database backends.
Go to Resource
dbplyr
dbplyr is a database backend for the dplyr package in R. It allows you to use remote database tables as if they are in-memory data frames by automatically converting dplyr code into SQL.
Go to Resource
Dependency-light hex stickers with {gex}
Rostrum.blog introduced a new R package, {gex}, formerly known as {hexbase}, for creating hexagon stickers. It aims to be lightweight by including only 'gridverse' packages. 'Gex' is a play on 'grid' and 'hex'. The post explains how {gex} differs from {hexbase} in creating hex stickers with R's grid system, using functions like add_border() that applies a cut-out effect for borders. Users can add text and images to hexagon shapes with a sequence of commands. The example demonstrates hex creation for the {gex} logo with image manipulation using {magick} and showcases loops for multiple images and text effects.
Go to Resource
devtools
devtools is an R package that aims to make package development easier by providing functions that simplify and expedite common tasks. It includes functions for loading code, updating documentation, running tests, building and installing packages, checking and releasing packages, and more. It is widely used for R package development and there are several resources available to learn more about package development using devtools.
Go to Resource
dplyr
dplyr is a package in R that provides a grammar of data manipulation. It offers a consistent set of verbs to solve common data manipulation challenges, such as adding new variables, selecting variables, filtering cases, summarizing data, and arranging rows. It also provides support for working with different computational backends, including arrow, dtplyr, dbplyr, duckplyr, duckdb, and sparklyr. The package can be installed as part of the tidyverse or separately.
Go to Resource
dplyr 1.2.0
dplyr 1.2.0 is a major release of the popular data manipulation package in R. The update introduces new features like filter_out() as a complement to the existing filter() function, as well as when_any() and when_all() helpers. It also adds functions such as recode_values(), replace_values(), and replace_when() to extend the capabilities for recoding and replacing data. These improvements have been shaped by the tidyverse community's tidyups proposal process, and the announcement encourages users to install the update from CRAN. Alongside providing code examples, the importance of understandable and maintainable code when filtering data is emphasized.
Go to Resource

DT
An R package that provides an interface to the DataTables library, allowing R data objects to be displayed as interactive tables on HTML pages.
Go to Resource
Easily Arrange External Figures with Patchwork Alongside ggplot2 Figures • figpatch
Easily Arrange External Figures with Patchwork Alongside ggplot2
Go to Resource
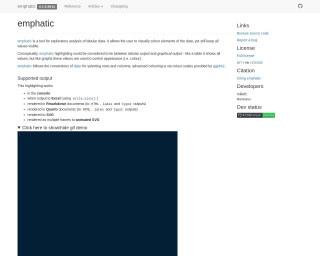
emphatic
emphatic is a package for R that enriches exploratory analysis of tabular data by allowing users to add visual color highlights. It bridges the gap between tabular and graphical output, displaying data values that control appearance, such as color, while still showing all values. Compatible with dplyr row and column selection, it also integrates with ggplot2's color scales. Outputs include console, Excel, Rmarkdown, Quarto, SVG, and animated SVG rendering. Features include data frame highlighting, difference highlighting between objects, regex matching, and conversion to HTML, SVG, or Excel. Installation via GitHub is straightforward.
Go to Resource