
Resources
This carefully curated collection of resources will help you find packages and learning resources to help you on your R journey.
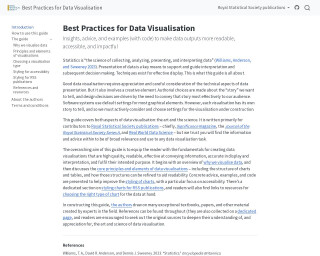
Best Practices for Data Visualisation
This content outlines best practices for creating effective and accessible data visualisations. It provides insights, advice, and code examples to enhance the readability and impact of data presentations. Emphasizing both the art and science of data visualisation, it guides readers through core principles and elements of designing charts and tables. The guide also addresses the need for authorial choices in storytelling through data and the importance of customizing default settings to convey information effectively. Aimed at Royal Statistical Society contributors, the advice is broadly applicable and includes resources for chart selection and accessibility.
Go to Resource
![Screenshot of Big Book of R at 400 [New milestone!]](/img/containers/screenshots/oscarbaruffa-com-bbor_400.jpg/74e022268aa288d6c1711920b3365082/oscarbaruffa-com-bbor_400.jpg)
Big Book of R at 400 [New milestone!]
Oscar Baruffa's 'Big Book of R' has reached a new milestone with over 400 entries of mostly free R books, witnessing the growth of an invaluable resource for the R community. Acknowledging contributors and the support of visitors, Baruffa emphasizes the quality and impact of the collection. The announcement highlights the costs associated with hosting the 'Big Book of R' and encourages contributions. New additions cover topics like big data analytics, hierarchical compartmental reserving models, R package design, epidemiology, causal data science, and psychometrics, showcasing the diversity and depth of the resources available.
Go to Resource
Bivariate choropleths are go!
This post explores bivariate choropleth maps, which blend two semi-transparent color schemes to represent two variables on a map. It delves into the practicalities of creating such maps with modern tools like R libraries, demonstrating the ease with which these visualizations can now be created. The post also touches on the modifiable areal unit problem (MAUP) and provides background on the development of bivariate choropleths in cartography. It offers a tutorial on using tmap to create these maps, referencing the work of Joshua Stevens and Cindy Brewer in the field.
Go to Resource
Bluesky conversation analysis with local and frontier LLMs with R/Tidyverse
This content details the author's exploration of bluesky conversation analysis using R and the Tidyverse suite, specifically focusing on local and frontier large language models (LLMs). The author leverages R packages atrrr, ellmer in the tidyverse, mlverse/mall, and interfaces with models such as Claude & Ollama. Processes include summarizing posts, performing sentiment analysis, and posting summaries to GitHub via the gistr R package. Techniques include data retrieval, text analysis, and summarization, showcasing how open models can provide insights into community discussions on Bluesky, particularly within the R community's use of the #Rstats hashtag.
Go to Resource
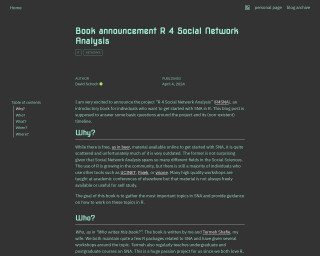
Book announcement R 4 Social Network Analysis
The blog post 'R 4 Social Network Analysis' announces an in-progress book aimed at introducing social network analysis (SNA) in R to practitioners. Authored by schochastics and Termeh Shafie, both of whom have extensive experience in SNA and R package development, the book will cover key SNA topics and demonstrate how to manage network analytical tasks in R. It addresses the scarcity and dispersal of current SNA learning materials and seeks to provide a central, up-to-date source. The book's practical focus is on applying R tools rather than delving into theory, making it suitable for those ready to apply SNA techniques. It is openly written on GitHub using quarto, inviting community feedback through issues.
Go to Resource

Branding and automating your work with R Markdown
This video is about branding and automating work with R Markdown. It discusses how a team of data scientists uses advanced features in RStudio to brand reports and presentations for clients. The speaker highlights lessons learned in areas like version control and automation, including how a few lines of code allowed them to create a specialized report on crime for every county in Utah.
Go to Resource
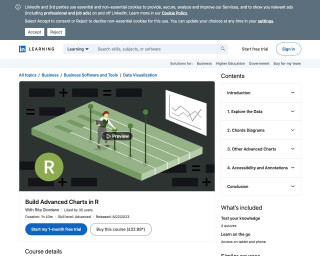
Build Advanced Charts in R
The LinkedIn Learning course 'Build Advanced Charts in R' by Rita Giordano is an advanced-level data visualization course. Over 1 hour and 43 minutes, students delve into creating sophisticated charts including lollipop plots, sparklines, dot charts, and slope charts. The course covers creating theme functions, combining plots, and ensuring accessibility with colorblind-friendly palettes and dyslexia-friendly fonts. Participants will learn when to use advanced charts, how to apply accessibility principles, and how to build a simple infographic. A downloadable certificate of completion enhances professional profiles, demonstrating data visualization proficiency in R.
Go to Resource
Build Advanced Charts in R Online Class | LinkedIn Learning, formerly Lynda.com
This online class on LinkedIn Learning (formerly Lynda.com) teaches users how to build advanced charts in R for data visualization. The course covers topics such as lollipop plots, sparklines, dot charts, slope charts, and chord diagrams. It also includes information on creating a theme function, combining multiple plots, and addressing accessibility and annotations. The instructor, Rita Giordano, is a data visualization consultant and LinkedIn Instructor.
Go to Resource
Building a Linkedin data visualisation template with Quarto and Typst
Aaron Schiff shares a method for sharing data visualizations on Linkedin using Quarto and Typst. He created a template that allows for the production of nicely formatted PDFs to circumvent Linkedin's subpar image handling. The template includes a topic heading, summary text, a ggplot chart, data source citation, optional two-column text, and a footer. Additionally, Schiff explains the synergy of Quarto, a publishing system, and Typst, a layout framework, to streamline the production of visually appealing PDFs. He provides guidance on creating a Quarto Typst template and how to use it with example code and the configuration process.
Go to Resource
Building R packages with devtools and usethis | RStudio - YouTube
This YouTube video provides a tutorial on building R packages using devtools and usethis in RStudio.
Go to Resource

Building Shiny apps - an interactive tutorial
An interactive tutorial on building Shiny apps, which are interactive web pages built using R.
Go to Resource