
Resources
This carefully curated collection of resources will help you find packages and learning resources to help you on your R journey.

Gentelella Shiny
This is an R Shiny HTML Template version of the gentelella bootstrap theme. It provides a unique looking Shiny dashboard with features like login authentication, dynamic progress bar visualization, custom boxes for plots, and more.
Go to Resource
ggfoundry
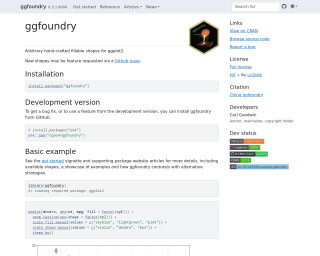
ggfoundry is an R package that extends ggplot2 by adding custom fillable shapes. Users can request new shapes through GitHub issues. The package is available on CRAN, with a development version on GitHub. It includes a vignette and articles on the package website for guidance. Examples showcase the integration of ggfoundry with ggplot2, presenting how to create plots with unique shapes like violins and dendrograms. This package is especially useful for creating distinctive and visually appealing data visualizations in R.
Go to Resource
ggmagnify
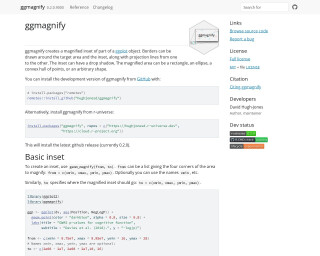
ggmagnify, an R package, enhances ggplot visualizations by adding a 'magnifying glass' effect. It allows for the creation of magnified insets to highlight important areas of plots, offering flexible customization options like borders, shadows, and shapes (rectangular, elliptical, convex hull, arbitrary). The package, installable from GitHub or r-universe, provides functions to specify both the target region and the inset location using coordinates. The comprehensive examples cover various use cases, including faceting and maps, illustrating ggmagnify's capability to accentuate data points or regions for increased clarity in ggplot graphics.
Go to Resource
ggplot2
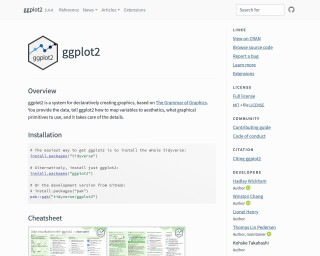
ggplot2 is a system for declaratively creating graphics, based on The Grammar of Graphics.
Go to Resource
ggplot2 4.0.0
ggplot2 4.0.0 marks a significant update of the popular data visualization package for R, introducing a shift in the underlying object-oriented system from S3 to S7 and other quality-of-life improvements. Celebrating its 18th anniversary, this release enhances the package's flexibility while enforcing stricter type validation for argument inputs. New theme functionalities differentiate between ink (foreground) and paper (background) aesthetics, adapting the way defaults are set and contributing to a more refined control over plot styling. This version is available for installation from CRAN and heralds future phased transitions favoring the S7 architecture.
Go to Resource
ggplot2 v3.5: Ignored Position Aesthetics
Evangeline 'Gina' Reynolds discusses the 'ignored position aesthetics' introduced in ggplot2 v3.5 on LinkedIn. This new feature allows x and y axis annotations within plots using I(), making it easier to mark high-level comments. Annotations are not bound to specific observations and can be placed anywhere in the plot space from 0 to 1, horizontally and vertically. The update simplifies adding comments without worrying about x and y axis limits. This enhancement is highly praised by the community for its usefulness in data visualization.
Go to Resource


ggtech
ggtech is a package that provides ggplot2 tech themes, scales, and geoms for creating visually appealing plots in R.
Go to Resource