
Resources
This carefully curated collection of resources will help you find packages and learning resources to help you on your R journey.
Create custom GPS route maps in R
This content is a tutorial by Nicola Rennie, published on November 23, 2025, about creating custom GPS route maps in R. It provides a step-by-step guide on how to use spatial data to produce printable maps, ideal for runners, cyclists, or anyone interested in learning about spatial data handling in R. The tutorial includes loading GPS data from files (such as .gpx), processing it using R packages like 'gpx', 'tidyverse', and 'sf', and then enhancing the maps with background data from OpenStreetMap through the 'osmdata' package.
Go to Resource
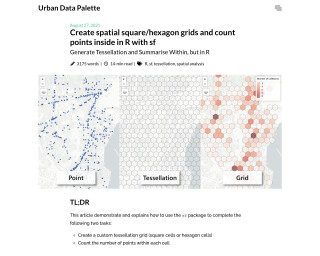
Create spatial square/hexagon grids and count points inside in R with sf | Urban Data Palette
Create spatial square/hexagon grids and count points inside in R with sf
Go to Resource
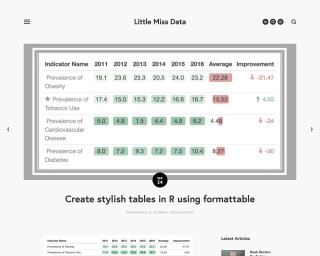
Create stylish tables in R using formattable
Create stylish tables in R using formattable
Go to Resource
Create, scan, and correct exams with R | by Edgar J. Treischl | Medium
This blog introduces the R exams package and shows how to create, scan, and correct student exams using R. It demonstrates how R scans exam images, extracts answers from single or multiple choice questions, and corrects them automatically. It also highlights the next steps and how they are implemented in R, as well as how to create your own exam questions. The package helps automate the entire process of generating, scanning, and assessing exams.
Go to Resource
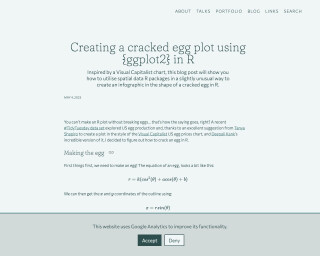
Creating a cracked egg plot using {ggplot2} in R | Nicola Rennie
Creating a cracked egg plot using {ggplot2} in R
Go to Resource
Creating a data pipeline with Github Actions & the {googledrive} package for the Canadian Premier League soccer data initiative!
Creating a data pipeline with Github Actions & the {googledrive} package for the Canadian Premier League soccer data initiative!
Go to Resource
Creating actually publication-ready figures for journals using ggplot2
Jorn Alexander Quent's tutorial introduces a workflow using ggplot2 for creating figures that are truly ready for journal publication. The guide begins by emphasizing the need to start with the correct dimensions as per journal guidelines. Quent then addresses the common problem of exported figures looking different than expected and offers solutions like using standard settings and custom themes. He also provides examples using the iris dataset to illustrate how to prepare figures that maintain proper proportions and aesthetics when saved at required dimensions, thus saving time and maintaining consistency in the figures produced.
Go to Resource
Creating Effective Display Tables with the gt Package
This content is a comprehensive guide titled 'Creating Effective Display Tables with the gt Package' by Richard Iannone. It introduces readers to building professional tables using the gt package in R. The book starts with basic table creation and progresses to advanced customization, with a focus on clarity, design, and functionality. It offers an intuitive, incremental approach to table building, with detailed instructions on formatting, layouts, and customization options for various output formats. Designed for a range of R users, the resource is both a tutorial and reference, containing reproducible examples, full code, and documented datasets for practical learning.
Go to Resource

Creating interactive visualizations with {ggiraph} (with or without Shiny)
Albert Rapp's blog post explains how to create interactive visualizations using the {ggiraph} package with or without Shiny in the R programming environment. It guides readers through the process of turning a ggplot into an interactive plot where users can focus on details that interest them. The tutorial includes data preparation with 'dplyr' and 'ggplot2', and demonstrates how to add interactivity to both lines and points in a chart. The post covers the use of 'geom_point_interactive', 'geom_line_interactive', and 'girafe()' function for rendering, and customization options for hover effects and plot sizing.
Go to Resource
Creating Polished, Branded Documents with Quarto
Isabella Velásquez from Posit delivers a comprehensive R/Pharma workshop on creating polished, professionally branded documents using Quarto. The talk covers Quarto’s key outputs—documents, presentations, websites, dashboards, and PDFs—and focuses heavily on theming and branding, including the use of brand.yml to define and apply consistent visual identities (colors, fonts, logos) across all output formats from a single configuration file.
Go to Resource
Creating post summary with AI from Hugging Face
Dr. Mowinckel discusses the use of Hugging Face's AI to automate the creation of SEO-friendly summaries for blog posts, which is both time-efficient and enhances discoverability. The tutorial encompasses acquiring the Hugging Face API key, structuring requests, and handling responses with the R package httr2. It also highlights the importance of concise summaries for both SEO and repository metadata, and details the workflow from content preparation to writing summaries to a file. Hugging Face’s community efforts and accessible APIs are commended for their ease of use and functionalities.
Go to Resource

Creating template files with R
Nicola Rennie's blog post teaches readers how to save time when dealing with repetitive tasks by creating template files with R. The post explains fine-tuning R scripts for tasks like #TidyTuesday, where similar sections are involved each week. Instead of copying and pasting scripts and GitHub README files weekly and updating parts manually, Rennie introduces a method for generating template files and folders based on a date argument. This process includes creating organized directories and template files, replete with content placeholders, which can then be customized for the specific week's work.
Go to Resource