
Resources
This carefully curated collection of resources will help you find packages and learning resources to help you on your R journey.
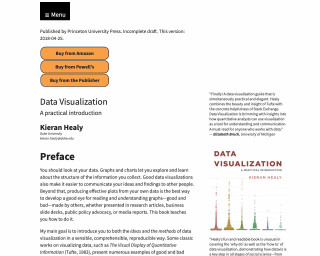
Data Visualization: A Practical Introduction
Data Visualization: A Practical Introduction, due for release in March 2026 from Princeton University Press, is a comprehensive guide that teaches the principles and methods necessary for effectively visualizing data. With a focus on R and ggplot2, the second edition incorporates significant updates, including the use of base R's pipe operator. The book aims to enable readers to reproduce the figures within and understand the underlying principles, bridging the gap between high-level concepts and practical implementation with graphical tools.
Go to Resource
Data Visualization: A Practical Introduction
This is a book about data visualization using R and ggplot. It covers various topics such as working with plain text, making plots, showing the right numbers, graphing tables, working with models, and drawing maps.
Go to Resource

Data wrangling for spatial analysis: R Workshop
Data wrangling for spatial analysis: R Workshop
Go to Resource
Dengue Data Hub
The Dengue Data Hub is a centralized platform that provides access to global dengue-related data across 225 countries. Launched and managed by Dr. Thiyanga S. Talagala, the hub is funded by the R Consortium, based in the USA. It is designed to facilitate the research and analysis of dengue fever patterns and trends. Users can explore and download datasets to study the impact of the disease, understand its prevalence, and potentially aid in the development of preventative measures. Researchers looking for dengue data can contact Dr. Talagala for more information.
Go to Resource
Dependency-light hex stickers with {gex}
Rostrum.blog introduced a new R package, {gex}, formerly known as {hexbase}, for creating hexagon stickers. It aims to be lightweight by including only 'gridverse' packages. 'Gex' is a play on 'grid' and 'hex'. The post explains how {gex} differs from {hexbase} in creating hex stickers with R's grid system, using functions like add_border() that applies a cut-out effect for borders. Users can add text and images to hexagon shapes with a sequence of commands. The example demonstrates hex creation for the {gex} logo with image manipulation using {magick} and showcases loops for multiple images and text effects.
Go to Resource

Don't use Quarto documents to clean or analyze data
This content advocates against using Quarto, R Markdown, or Jupyter for data cleaning and analysis, emphasizing that these platforms should be used for communication rather than exploratory tasks. Diego Catalan Molina advises that data inputs should be clean before being loaded into documents which should serve as a vehicle to tell a story. He suggests creating engaging outlines focused on findings' importance and using these documents exclusively to share results, not every plot or table during the exploratory phase of data analysis.
Go to Resource
Dr. U - Images as Facet Labels in ggplot2
This post explains how to replace the facet labels in ggplot2 with images, specifically country flags. It demonstrates how to load the required packages, obtain flag images from a GitHub repository, join the flag data with the gapminder dataset, download the flag images, generate markdown for reading the images, and create a plot with the flag images as facet labels.
Go to Resource
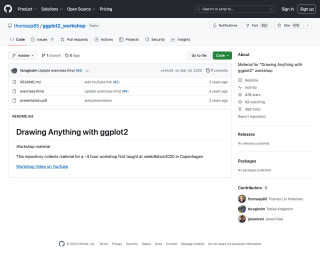
Drawing Anything with ggplot2
Material for the 'Drawing Anything with ggplot2' workshop by thomasp85
Go to Resource
Duplicating Quarto elements with code templates to reduce copy and paste errors
This blog post from the Water Data For The Nation Blog demonstrates how to use Quarto code templates to create reproducible Quarto documents, such as reports and slideshows, with fewer errors. Using custom templates allows for the easy replication of code chunks, such as those producing statistical summaries or visualizations for different datasets. The example used is USGS streamgage data, with a focus on automating the creation of slideshows in Quarto's markdown format. Advanced topics like adding columns, tables, and speaker notes to PowerPoint slides via Quarto are also covered. Methods for iterating over data in a more efficient and less error-prone way than traditional copy and paste techniques are highlighted.
Go to Resource