
Tidy Data Rule #1: Every Column is a Variable
This lesson is called Tidy Data Rule #1: Every Column is a Variable, part of the Going Deeper with R course. This lesson is called Tidy Data Rule #1: Every Column is a Variable, part of the Going Deeper with R course.
Transcript
Click on the transcript to go to that point in the video. Please note that transcripts are auto generated and may contain minor inaccuracies.
Loading transcript...
View code shown in video
# Load Packages -----------------------------------------------------------

library(tidyverse)
library(fs)
library(readxl)
library(janitor)

# Create Directories ------------------------------------------------------

dir_create("data-raw")

# Download Data -----------------------------------------------------------

# https://www.oregon.gov/ode/educator-resources/assessment/Pages/Assessment-Group-Reports.aspx

# download.file("https://www.oregon.gov/ode/educator-resources/assessment/Documents/TestResults2122/pagr_schools_math_tot_raceethnicity_2122.xlsx",
#               mode = "wb",
#               destfile = "data-raw/pagr_schools_math_tot_raceethnicity_2122.xlsx")
#
# download.file("https://www.oregon.gov/ode/educator-resources/assessment/Documents/TestResults2122/TestResults2019/pagr_schools_math_tot_raceethnicity_1819.xlsx",
#               mode = "wb",
#               destfile = "data-raw/pagr_schools_math_tot_raceethnicity_1819.xlsx")
#
# download.file("https://www.oregon.gov/ode/educator-resources/assessment/TestResults2018/pagr_schools_math_raceethnicity_1718.xlsx",
#               mode = "wb",
#               destfile = "data-raw/pagr_schools_math_raceethnicity_1718.xlsx")
#
# download.file("https://www.oregon.gov/ode/educator-resources/assessment/TestResults2017/pagr_schools_math_raceethnicity_1617.xlsx",
#               mode = "wb",
#               destfile = "data-raw/pagr_schools_math_raceethnicity_1617.xlsx")
#
# download.file("https://www.oregon.gov/ode/educator-resources/assessment/TestResults2016/pagr_schools_math_raceethnicity_1516.xlsx",
#               mode = "wb",
#               destfile = "data-raw/pagr_schools_math_raceethnicity_1516.xlsx")

# Import Data -------------------------------------------------------------

math_scores_2021_2022 <-
  read_excel(path = "data-raw/pagr_schools_math_tot_raceethnicity_2122.xlsx") |>
  clean_names()

# Tidy and Clean Data -----------------------------------------------------

third_grade_math_proficiency_2021_2022 <-
  math_scores_2021_2022 |>
  filter(student_group == "Total Population (All Students)") |>
  filter(grade_level == "Grade 3") |>
  select(school_id, contains("number_level")) |>
  pivot_longer(
    cols = -school_id,
    names_to = "proficiency_level",
    values_to = "number_of_students"
)Your Turn
Do the following to create a new data frame called enrollment_by_race_ethnicity_2022_2023:
Start with the
enrollment_2022_2023data frame.select()thedistrict_institution_idandschool_institution_idvariables as well as those about number of students by race/ethnicity and get rid of all others.Use
pivot_longer()to convert all of the race/ethnicity variables into one variable.Within
pivot_longer(), use thenames_toargument to call that variablerace_ethnicity.Within
pivot_longer(), use thevalues_toargument to call that variablenumber_of_students.
Start with the code below.
# Load Packages -----------------------------------------------------------

library(tidyverse)
library(fs)
library(readxl)
library(janitor)

# Create Directories ------------------------------------------------------

dir_create("data-raw")

# Download Data -----------------------------------------------------------

# https://www.oregon.gov/ode/reports-and-data/students/Pages/Student-Enrollment-Reports.aspx

# download.file("https://www.oregon.gov/ode/reports-and-data/students/Documents/fallmembershipreport_20222023.xlsx",
#               mode = "wb",
#               destfile = "data-raw/fallmembershipreport_20222023.xlsx")
#
# download.file("https://www.oregon.gov/ode/reports-and-data/students/Documents/fallmembershipreport_20212022.xlsx",
#               mode = "wb",
#               destfile = "data-raw/fallmembershipreport_20212022.xlsx")
#
# download.file("https://www.oregon.gov/ode/reports-and-data/students/Documents/fallmembershipreport_20202021.xlsx",
#               mode = "wb",
#               destfile = "data-raw/fallmembershipreport_20202021.xlsx")
#
# download.file("https://www.oregon.gov/ode/reports-and-data/students/Documents/fallmembershipreport_20192020.xlsx",
#               mode = "wb",
#               destfile = "data-raw/fallmembershipreport_20192020.xlsx")
#
# download.file("https://www.oregon.gov/ode/reports-and-data/students/Documents/fallmembershipreport_20182019.xlsx",
#               mode = "wb",
#               destfile = "data-raw/fallmembershipreport_20182019.xlsx")

# Import Data -------------------------------------------------------------

enrollment_2022_2023 <- read_excel(path = "data-raw/fallmembershipreport_20222023.xlsx",
                                   sheet = "School 2022-23") |>
clean_names()Learn More
There is also a pivot_wider() function that does the opposite of pivot_longer(). You'll learn about this in the Tables lesson.
R for the Rest of Us consultant Albert Rapp has written a couple blog posts on basic and advanced pivoting.
Below, I've embedded a website made by Hasse Walum that provides a visual representation of how the pivot_longer() function works.
There’s also a nice article by Gavin Simpson of University College, London about pivoting. That article includes the animations below, made by Garrick Aden-Buie and Mara Averick, that gave a visual demonstration of pivoting.
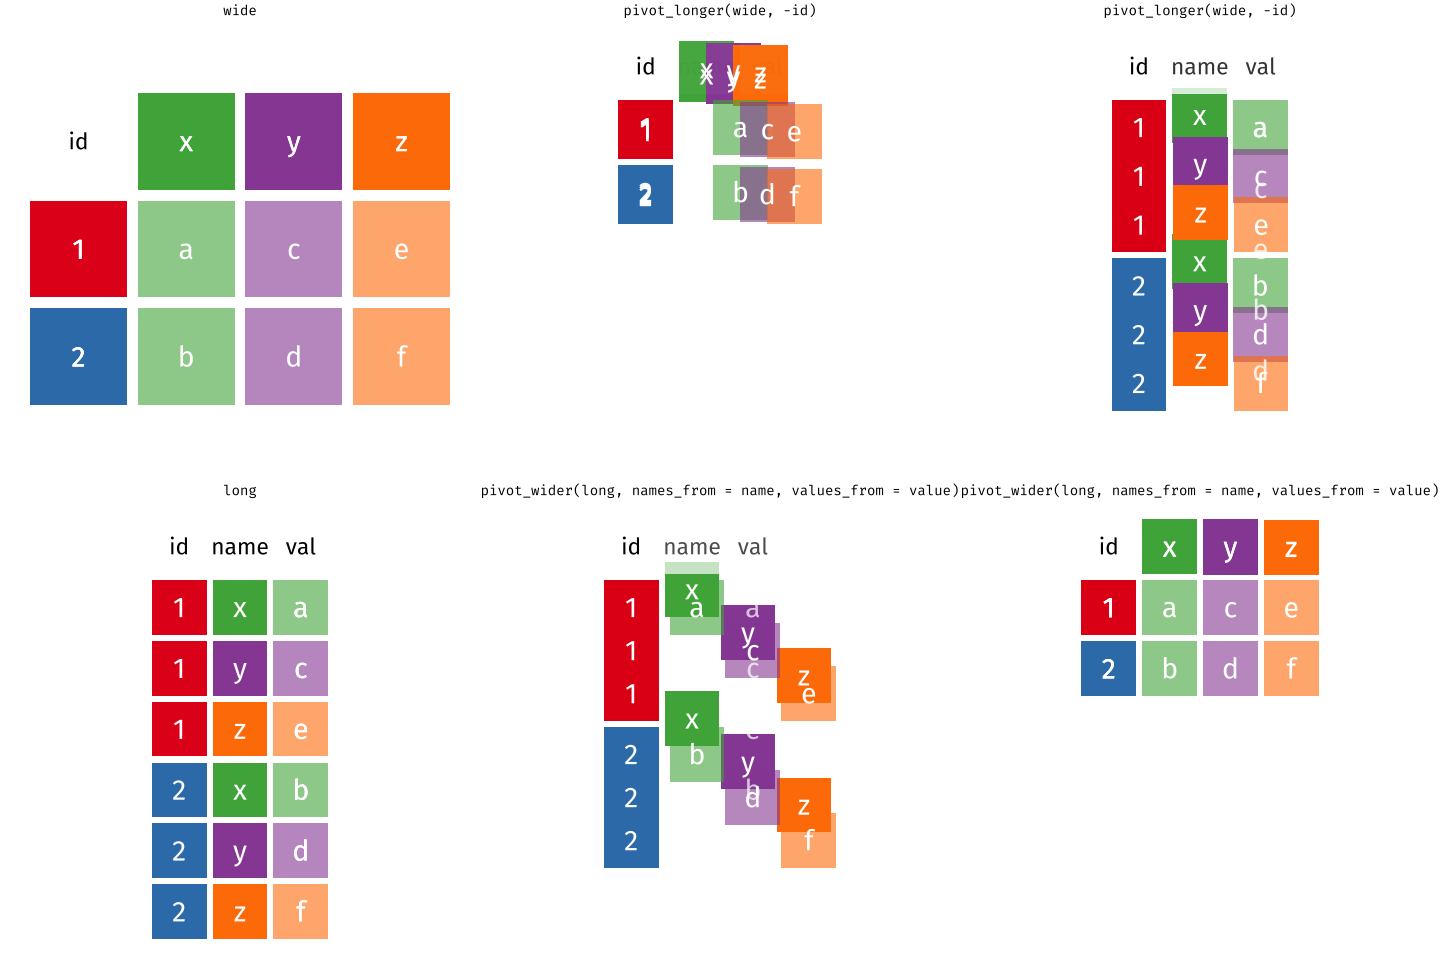
Posit has a nice primer on reshaping data, complex with a few exercises.
Finally, a heads up: if you ever see references to the functions gather() and spread(), these are the previous iterations of the pivot functions. They still work (as the tweet below from tidyverse developer Hadley Wickham indicates), but the pivot functions are, in my view (and the view of many others), much easier to use.
Have any questions? Put them below and we will help you out!
Course Content
44 Lessons
You need to be signed-in to comment on this post. Login.