
Resources
This carefully curated collection of resources will help you find packages and learning resources to help you on your R journey.
How Major League Teams use R to Analyze Baseball Data
Keith Woolner, on September 27, 2023, delivers a presentation showcasing how Major League Baseball teams utilize the R programming language to perform data analysis on baseball statistics. The video, available on YouTube, dives into methodologies and tools used within the industry to crunch numbers and derive insights that can potentially give teams a competitive edge. It touches upon predictive modeling, player performance evaluation, and related statistical techniques, evidencing R's pivotal role in sports analytics and data-driven decision-making in professional baseball.
Go to Resource
How to Turn Messy PDFs into Clean Data Frames with R and Elmer
Albert Rapp demonstrates how to use the {ellmer} package to leverage AI models for extracting data from messy PDF files. If you’ve ever struggled with getting clean data out of PDFs, you know how challenging this task can be. This tutorial shows how AI can streamline this traditionally painful process, making it much easier to transform unstructured PDF content into usable data frames in R.
Go to Resource
How to use R to dig for story ideas
The tutorial details the use of R for data journalism, particularly for investigating datasets to uncover story ideas. Highlighted at the Investigative Reporters and Editors conference by Charles Minshew, it emphasizes using R scripts, Tidyverse, and readxl packages to explore a dataset of Boston government employee earnings. By questioning datasets with basic R code, journalists can extract information such as salary attributes, department sizes, and common job titles. It also suggests using descriptive statistics to identify leads for stories, like discovering high earners within the data.
Go to Resource
Introducing Databot: An AI assistant for exploratory data analysis
Databot is an AI-powered assistant developed by Posit to augment the exploratory data analysis (EDA) capabilities of data scientists who use Python or R. This ambitious application of large language models (LLMs) aims to fast-track the EDA process, which conventionally takes hours, down to just minutes. Unlike autonomous or sandbox-constrained AI agents, Databot works interactively in a highly collaborative 'pair programming' style, engaging the user with rapid code-writing, execution, and analysis. It employs a cycle termed the 'WEAR loop' to ensure insights are reliable, serendipitous, and transparent. Databot remains a research preview exclusively available for Positron users.
Go to Resource

Introduction to web scraping
Stein Arne Brekke provides an introductory guide to web scraping judicial data in R, focusing on creating a dataset from UK Supreme Court decisions. Emphasizing empirical legal studies, the guide covers data gathering from online sources through programming. It offers a step-by-step process for scraping and organizing data into usable tables for research, using R. Beginners are pointed to additional learning resources, and the guide includes sections on scraping, data management, analysis, and legal considerations. It encourages sharing collected data to aid comparative legal research.
Go to Resource
Look at your objects
The content discusses various methods to 'check in' on intermediate R objects during data analysis, emphasizing good practice for understanding data at each step. The author examines classic printing to the console, the use of semicolons, parenthesis for immediate output, inspecting data within pipelines, and summary functions like `glimpse()` that continue the pipeline. The post critiques each method's practicality, such as the cumbersomeness of multiline code or missing pipe symbols, and recommends best practices for students and analysts to monitor their data at different stages of analysis, using functions from libraries like tidyverse and magrittr.
Go to Resource
Make simpler working with environmental data products • tidypollute
tidypollute is an R package designed to streamline the process of working with EPA AirData flat files and AQS API for environmental data analysis. Developed by Dr. Nelson Roque, the package provides tools for importing, cleaning, analyzing, and visualizing large-scale air pollution datasets. It's built with the tidyverse ethos, ensuring tidy and efficient data handling. Key features include processing EPA data files, extracting Atmotube Cloud API data, and soon to be added are real-time API queries, quick visualization tools, documentation generation, and demographic data integration.
Go to Resource
Outliers in Data Analysis: Detecting Extreme Values Before Modeling in R
This content provides a comprehensive guide on detecting outliers in data analysis before modeling using R, with a specific focus on Airbnb listings data from Istanbul. It emphasizes the importance of understanding the statistical implications of outliers and how they can distort statistical analysis and modeling efforts. The guide demonstrates practical outlier detection methods and includes R code for loading and pre-processing the Airbnb dataset, while also discussing relevant statistical concepts and the importance of making informed preprocessing decisions. Example variables such as price, minimum_nights, and room_type are used for illustration.
Go to Resource
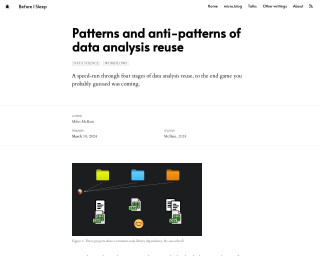
Patterns and anti-patterns of data analysis reuse
The blog post titled 'Before I Sleep: Patterns and anti-patterns of data analysis reuse' by Miles McBain discusses the common themes in data analysis roles pertaining to the repeated nature of certain analyses across various industries. McBain highlights the need for reusing code and strategies efficiently to maintain productivity amidst this recurring challenge. The text delves into different stages of data analysis reuse, such as copy-pasting previous work, which may initially save time but lead to accruing technical debt. It stresses on setting up practices for swift reuse of work to build upon proven capabilities, assuming the work is code-based and document-like products are code-generated.
Go to Resource
Posit AI Newsletter
Posit's blog for August 29, 2025, announces the publication of an AI newsletter curated by Sara Altman and Simon Couch, previously internal, now available biweekly. The newsletter discusses significant AI developments including environmental reports on LLMs by Mistral AI and Google, and introduces Positron Assistant and Databot for R/Python coding and data analysis. It raises awareness about the energy demands of AI during training and inference stages, emphasizes responsible AI tool usage, and shares external insights and resources on AI advancements and security vulnerabilities with the data science community.
Go to Resource
Qualitative Analysis with Large Language Models • quallmer
The quallmer package leverages AI, particularly large language models, for qualitative data analysis. It assists researchers in coding texts, images, PDFs, tabular, and structured data. quallmer simplifies AI-assisted qualitative coding, ensuring the quality and reliability of AI-generated codes with functions for codebook creation, coding, comparison, validation, replication, and documenting audit trails. It supports all LLMs available with the ellmer package and includes a Shiny app for an interactive experience.
Go to Resource
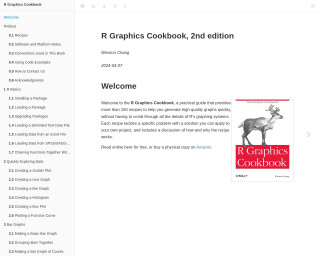
R Graphics Cookbook, 2nd edition
The 'R Graphics Cookbook, 2nd edition' serves as a practical guide that offers a wide array of graphical examples using R. It encompasses a collection of recipes addressing common tasks and problems for creating graphics in R. The book is designed to help readers quickly find and implement solutions for various data visualization scenarios, covering topics from basic R installation, loading packages, and importing data, to generating different types of plots such as bar graphs, line graphs, and scatter plots. Essential for both beginners and experienced R users, the cookbook-style format makes it an accessible and valuable resource for effective data visualization.
Go to Resource