
Resources
This carefully curated collection of resources will help you find packages and learning resources to help you on your R journey.
Reproducible Data Science in R: Say the quiet part out loud with assertion tests
This blog post explores the role of assertion tests in reproducible data science when using R. The author, Anthony Martinez, walks through a tutorial on improving the robustness of R functions with assertions, beginning with basic checks and evolving to more expressive error messages. The post, intended for novice and intermediate R users, is part of a series on functional programming and reproducibility using the targets package. It highlights the importance of failing early with clear messages in multi-person projects and offers examples using the geoconnex.us database to retrieve Hydrologic Unit boundary polygons.
Go to Resource
resouRces
This content encompasses a comprehensive list of R-related educational materials, packages, tutorials, and datasets with projected dates ranging up to the year 2025. It includes various titles that focus on learning R programming, data analysis, data visualization, geospatial mapping, and statistical methods. Significant emphasis is placed on resources for learning R, such as introductions to R, books, courses, and video tutorials. Additionally, specific packages for data wrangling, statistical modeling, and visualization are mentioned, indicating the evolution and specialization of R's ecosystem to cater to diverse data science needs.
Go to Resource
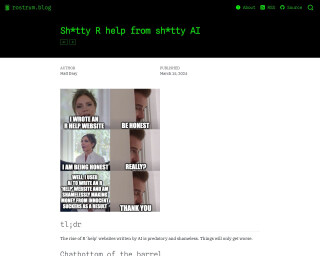
Sh*tty R help from sh*tty AI
The blog post from rostrum.blog critiques the proliferation of R help websites that use low-quality AI-generated content to exploit vulnerable learners for profit. The author observes these sites featuring predatory practices such as affiliate marketing without providing valuable help, producing numerous pages with slightly altered content for SEO gains, and dishonestly attributing authorship to non-existent human writers. The post warns readers to be cautious and recognize that these sites offer poor advice, often including incorrect or non-functional code, and may feature content pirated from legitimate creators without consent.
Go to Resource
Slidecrafting
Slidecrafting is a guide by Emil Hvitfeldt on creating functional and aesthetically pleasing slides using Quarto presentations. Published on September 24, 2025, the book emphasizes the art of slidecrafting, with advice applicable to various slide technologies. It offers readers knowledge on theming, content layout, and interactivity in slides, alongside SCSS tips and extensions. The book aims to aid readers in developing their style while ensuring the constant elements of presentations are refined, suggesting the use of Quarto's reveal.js documentation for mastery.
Go to Resource
Ten great R functions #3
Erik Gahner Larsen's blog post shares another ten essential R functions to aid users with different tasks in 2024, some new and some old. The post includes functions like reprex::reprex() for creating reproducible examples, data.table::let() for easier data manipulation, renv::init() for reproducible environments, and directlabels::geom_dl() for enhanced data visualizations. These functions cater to a variety of needs from efficient data frame manipulation to ensuring reproducibility, and from enhancing visual outputs to managing project environments effectively.
Go to Resource
tidykids
State-by-State Spending on Kids Dataset from the Urban Institute in a Tidy Format
Go to Resource
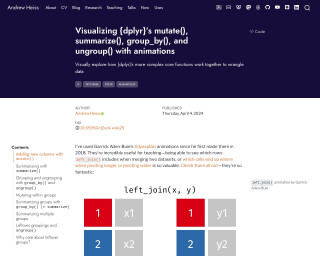
Visualizing {dplyr}’s mutate(), summarize(), group_by(), and ungroup() with animations
Andrew Heiss explores {dplyr} functions like mutate(), summarize(), group_by(), and ungroup() through handmade animations. Heiss illustrates the complexities of data manipulation workflow steps that are not immediately obvious when performing operations like adding new columns or summarizing data. This tutorial helps conceptualize the impact of these functions on data frames by visualizing their behind-the-scenes mechanics. The animations serve as an effective teaching tool to demystify what happens to data during different stages of the tidyverse's split/apply/combine paradigm, using handcrafted illustrations to make the learning process more intuitive.
Go to Resource
Vizualizing global testosterone levels by country
This article by Aspire Data Solutions outlines the process of web scraping testosterone levels for different countries from the World Population Review website and creating a choropleth map to visualize the data in R. It demonstrates how to gather, clean, and plot geographical data, cautioning that this ecological dataset is approximate, not age-standardized, and should be used for identifying patterns rather than for precise comparisons or causal inferences. The author, Mihiretu Kebede (PhD), also includes code snippets and explanations for the R packages used.
Go to Resource
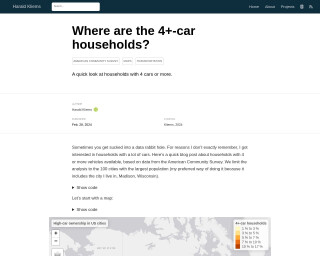
Where are the 4+-car households?
Harald Kliems investigates the prevalence of 4+-car households in the 100 most populous US cities using data from the American Community Survey. The blog post highlights the spatial distribution of such households and contrasts the top and bottom ten cities in terms of the percentage of 4+-car ownership. Key R packages used in the analysis include tidyverse, tidycensus, tigris, gt, and tmap. This examination into the facets of American car ownership is accompanied by visualizations such as maps and tables, enabling deeper insights into the data.
Go to Resource