
Resources
This carefully curated collection of resources will help you find packages and learning resources to help you on your R journey.
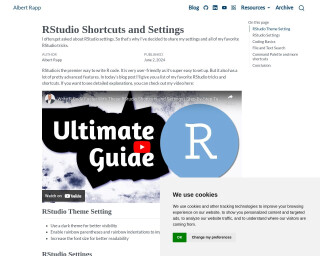
RStudio Shortcuts and Settings
Albert Rapp provides a guide for maximizing productivity in RStudio with shortcuts and settings. This post covers visual adjustments like themes, legibility improvements, and editor configurations, alongside tips for efficient code execution, debugging, and navigation. Rapp emphasizes starting with a clean environment, highlights key shortcuts for coding basics, file searching, command palette, and session management. The aim is to enhance user experience, reduce reliance on the mouse, and improve coding workflow. Ideal for R users looking to streamline their RStudio setup.
Go to Resource
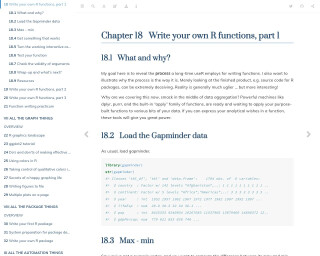
Stat545: Chapters 18-20: Write your own functions
Chapter 18 Write your own R functions, part 1
Go to Resource
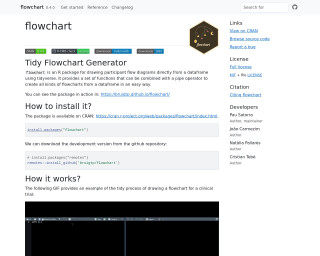
Tidy Flowchart Generator
The Tidy Flowchart Generator, or the 'flowchart' package, is an R package designed for drawing participant flow diagrams directly from a dataframe, employing the tidyverse syntax. It offers a suite of functions that utilize the pipe operator to generate flowcharts conveniently and flexibly from dataframes. The package is accessible through CRAN and can be installed traditionally or via the development version on GitHub. The process of creating a flowchart with this tool is demonstrated through a GIF example on its homepage, showcasing its usefulness in drafting flow diagrams for clinical trials or similar studies.
Go to Resource
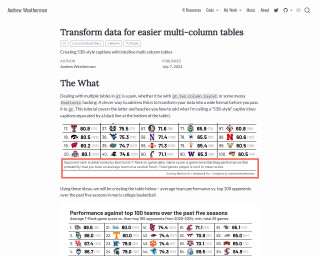
Transform data for easier multi-column tables
Andrew Weatherman's tutorial provides a step by step guide on transforming data into a wide format to facilitate the creation of intuitive multi-column tables in R using the gt package. It shows how to apply a "538-style" caption to add visual clarity to average team performance statistics against top 100 opponents in men's college basketball over the past five seasons. The tutorial includes detailed explanation of the data manipulation process and the R code needed to produce a visually appealing and informative table.
Go to Resource
Using renv in R
The content is a blog post by Erik Gahner Larsen discussing the use of the 'renv' package in R for managing package dependencies and ensuring reproducibility in R projects. It highlights issues faced when R scripts fail due to package updates or system changes and presents 'renv' as a solution for creating isolated project environments with specific package versions. This ensures that R scripts remain functional over time by snapshotting and restoring package states, thus allowing others to run the code with the intended results, even if the R landscape changes.
Go to Resource
Welcome to ModernDive (v2) | Statistical Inference via Data Science
ModernDive (v2) is the website for 'Statistical Inference via Data Science: A ModernDive into R and the Tidyverse (Second Edition)'. It showcases updates from the first edition, which is available online and for purchase. The book, authored by Chester Ismay, Albert Y. Kim, and Arturo Valdivia, teaches R and data science concepts. It's scheduled for print by CRC Press in 2025 and is licensed under Creative Commons. Readers can contribute on GitHub and anticipate a resource-rich approach to stats with a focus on tidyverse tools for data analysis.
Go to Resource
Working with colours in R
This blog post by Nicola Rennie guides readers on effectively using colors in R for data visualization or generative art. It discusses various methods to define colors, choosing suitable color palettes, and generating custom color schemes, without delving deeply into plot implementation. A useful 'plot_palette()' function is provided with examples. Readers learn about color names, hex codes, and RGB values, and how to apply them in R, with references to further resources.
Go to Resource