
Resources
This carefully curated collection of resources will help you find packages and learning resources to help you on your R journey.
{FakeDataR}
{FakeDataR} is an R package that provides a local solution for creating synthetic copies of real datasets, preserving their structure, schema, types, and privacy. It prevents the risk of exposing sensitive data and is designed to support Large Language Model (LLM) workflows and reproducible sharing. The package includes heuristics for identifying sensitive fields, with the ability to fake or drop them, and supports exporting synthetic data along with a JSON schema and README prompt for LLM bundles. It's a suitable tool for creating quick, privacy-preserving synthetic data without the need for cloud processing.
Go to Resource
A personal history of the tidyverse
This content presents a personal history of the tidyverse, a collection of R packages for data science, as seen through the eyes of the creator, Hadley Wickham. The article traces the evolution of the tidyverse from its early beginnings to its current status as a major tool in the R ecosystem. It reflects on the growth from individual projects to a collaborative community effort, supported by both Posit (formerly RStudio) and users worldwide, spanning almost 20 years and over 500 releases. The tidyverse's defining features, its significance, and the future vision are all discussed, emphasizing its open-source philosophy and contribution to data analysis and data warehousing.
Go to Resource

Data Cleaning Flipbook
A flipbook with examples of data cleaning using R and the tidyverse package
Go to Resource
Data Science for the Biomedical Sciences
Data Science for the Biomedical Sciences is a book that provides an introduction to data science concepts and tools specifically tailored for the biomedical sciences. It covers topics such as spreadsheets, R and RStudio, data loading, descriptive calculations, data cleaning, visualization, analysis, working with multiple datasets, APIs, functions, survival analysis, machine learning, and more.
Go to Resource
How (and Why) I came to Use R for Data Analysis and Evaluation
Alberto Espinoza recounts his journey with R for data analysis and evaluation, marking his 10-year experience since first encountering R during his graduate assistantship. Initially clueless about R, he was tasked with assisting and leading statistics labs using R. Despite early challenges and a steep learning curve, he recognized R's power over software like SPSS or Excel. His continued use of R spanned graduate projects, market research, data preparation for Tableau, and Survey Monkey analysis. Espinoza outlines R's advantages: reproducibility, efficiency, clarity, and an extensive package ecosystem, underlining R's significance in his professional growth.
Go to Resource

Jonathan Kitt - #TidyTuesday 2023 - Week 31
This is a tutorial on how to participate in the #TidyTuesday weekly challenge, organized by the R4DS Online Learning Community. The tutorial covers loading packages, downloading the dataset, cleaning the data, and creating visualizations.
Go to Resource
LA County Population Data Viz
This content outlines a detailed example of accessing and visualizing population data for Los Angeles County using R programming language. It provides insights into the population size of LA County compared to the city proper and the greater metropolitan area. Additionally, the text includes R code that interacts with the U.S. Census Bureau API, demonstrating how to retrieve, filter, and arrange population estimates with county-level granularity and geometry data for mapping. The snippet focuses on data manipulation and visualization techniques using tidyverse and tidycensus, highlighting the practical application of these tools in demographic analysis.
Go to Resource
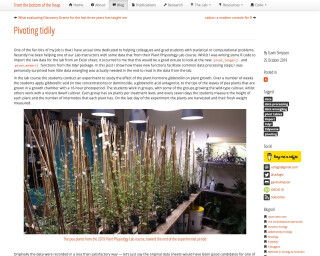
Pivoting tidily
This post discusses the new pivot_longer() and pivot_wider() functions from the tidyr package in R. It demonstrates how these functions can facilitate common data processing steps and reduce the need for extensive data wrangling. The post uses an example from a Plant Physiology Lab course to illustrate the use of these functions.
Go to Resource

resouRces
This content encompasses a comprehensive list of R-related educational materials, packages, tutorials, and datasets with projected dates ranging up to the year 2025. It includes various titles that focus on learning R programming, data analysis, data visualization, geospatial mapping, and statistical methods. Significant emphasis is placed on resources for learning R, such as introductions to R, books, courses, and video tutorials. Additionally, specific packages for data wrangling, statistical modeling, and visualization are mentioned, indicating the evolution and specialization of R's ecosystem to cater to diverse data science needs.
Go to Resource

RStudio Cloud Primer: Tidy Your Data
Posit Cloud is a cloud-based platform that provides data storage and analysis tools for the R programming language.
Go to Resource

Stat545
This is the table of contents for the STAT 545 resource, which covers various topics related to R programming.
Go to Resource