
Resources
This carefully curated collection of resources will help you find packages and learning resources to help you on your R journey.

Tidy data for efficiency, reproducibility, and collaboration
This illustrated series discusses the power of tidy data for efficiency, reproducibility, and collaboration in data science. It emphasizes the importance of organizing data in a structured and standardized format, which enables the use of existing tools, facilitates collaboration, and enhances reproducibility. The series provides examples and resources for working with tidy data and highlights its benefits in data analysis and research.
Go to Resource
Tidy Data Vignette
Tidy data is a concept in data analysis that involves structuring datasets to facilitate analysis. The tidy data standard provides a standardized way to organize data values within a dataset. This resource is a vignette that explains the principles and importance of tidy data and provides examples in R using the tidyr package.
Go to Resource
Tidy Flowchart Generator
The Tidy Flowchart Generator, or the 'flowchart' package, is an R package designed for drawing participant flow diagrams directly from a dataframe, employing the tidyverse syntax. It offers a suite of functions that utilize the pipe operator to generate flowcharts conveniently and flexibly from dataframes. The package is accessible through CRAN and can be installed traditionally or via the development version on GitHub. The process of creating a flowchart with this tool is demonstrated through a GIF example on its homepage, showcasing its usefulness in drafting flow diagrams for clinical trials or similar studies.
Go to Resource
tidyr
The `tidyr` package in R is used to create tidy data, where every column is a variable, every row is an observation, and every cell is a single value. It provides functions for pivoting, rectangling, nesting, splitting and combining character columns. The package supersedes `reshape2` and `reshape` and is designed specifically for tidying data. It has an active community and a Contributor Code of Conduct.
Go to Resource
Welcome to ModernDive (v2) | Statistical Inference via Data Science
ModernDive (v2) is the website for 'Statistical Inference via Data Science: A ModernDive into R and the Tidyverse (Second Edition)'. It showcases updates from the first edition, which is available online and for purchase. The book, authored by Chester Ismay, Albert Y. Kim, and Arturo Valdivia, teaches R and data science concepts. It's scheduled for print by CRC Press in 2025 and is licensed under Creative Commons. Readers can contribute on GitHub and anticipate a resource-rich approach to stats with a focus on tidyverse tools for data analysis.
Go to Resource
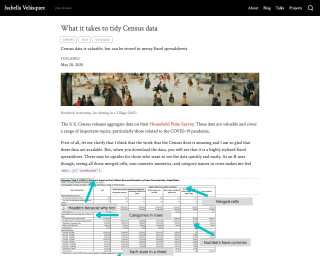
What is Takes to Tidy Census Data
This article explains the process of tidying Census data using R and tidyverse packages.
Go to Resource
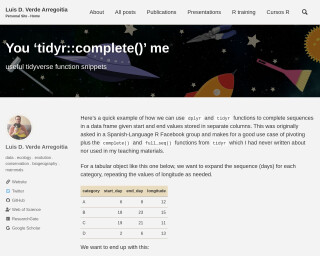
You ‘tidyr::complete()’ me
Luis D. Verde Arregoitia's article demonstrates using the 'complete()' function from the tidyr package to expand a data frame's sequences based on start and end values within columns. The example showcases how to pivot data and use 'complete()' and 'full_seq()' functions for filling in sequences of days for different categories, while repeating longitude values accordingly. This technique is useful for managing tabular data in wide format, facilitating transformations into a long format ready for analysis. The article is instructional for those working with R in ecology, conservation, and biogeography, focusing on data wrangling challenges.
Go to Resource