
Resources
This carefully curated collection of resources will help you find packages and learning resources to help you on your R journey.
A Comprehensive Collection of Crime-Related Datasets • crimedatasets
The crimedatasets package in R provides an extensive array of crime-related datasets. It's tailored for users interested in crime analysis, criminology, and studying socio-economic factors related to criminal activity. It offers a broad range of data types including tables, tibbles, spatial data, and time series, each with a specific naming convention for ease of use. Installation is straightforward via CRAN, and the package puts various global and local crime datasets at one's fingertips for research and educational purposes, such as datasets on US cybersecurity breaches and New Zealand murders.
Go to Resource
A Comprehensive Collection of U.S. Datasets • usdatasets
The usdatasets package provides an essential collection of U.S.-specific datasets suitable for analysis in various fields like crime, economics, education, and healthcare. It includes datasets with suffixes denoting their type, aiding in identification and usage. The package can be installed from CRAN and is easy to use, making it a valuable tool for researchers and analysts working with U.S. data. It follows a consistent naming convention to indicate data structures, such as time series (_ts) or data frames (_df), simplifying the data analysis process.
Go to Resource
A year with Visible Long-Covid Tracking
Dr. Mowinckel shares insights on a year-long journey of tracking Long Covid symptoms using the Visible app. The app monitors heart rate, HRV, daily symptoms, and functional capacity through the FUNCAP27 questionnaire. The post details the process of collecting and analyzing personal health data to understand recovery patterns, pacing strategies, and warning signs. The blog also offers a look at tools within Visible that help visualize progress, such as heart rate graphs and a functional capacity semi-circle, providing a valuable resource for individuals managing Long Covid.
Go to Resource
Applied Data Skills
The 'Applied Data Skills' book by Emily Nordmann and Lisa DeBruine is designed to teach the fundamentals of data processing and presentation using R. It guides learners through data import, cleaning, summarization, visualization, and report generation, aiming to provide skills for professional reporting and presenting. The book is part of a 10-week course with each chapter introducing new concepts and practical exercises. It emphasizes learning through practice, error resolution, and the efficient use of help resources rather than memorization. The goal is to enable learners to create automated, updateable reports and visualizations with R.
Go to Resource
Architecting a Data-Driven Meritocracy for Kenyan Baseball
Keith Karani, founder of Diamond Digest Labs, writes about building Basepoint, a data platform designed to close what he calls the “Visibility Gap” in sports analytics for emerging markets. In Kenya, valuable baseball performance data exists but sits fragmented across local spreadsheets and individual team devices, invisible to scouts and the wider world. Basepoint addresses this by migrating those raw, scattered statistics into a centralized, cloud-native database connected via Positron, turning hidden local data into a verified, scout-ready digital CV for Kenyan players.
Go to Resource
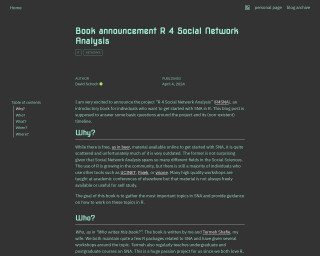
Book announcement R 4 Social Network Analysis
The blog post 'R 4 Social Network Analysis' announces an in-progress book aimed at introducing social network analysis (SNA) in R to practitioners. Authored by schochastics and Termeh Shafie, both of whom have extensive experience in SNA and R package development, the book will cover key SNA topics and demonstrate how to manage network analytical tasks in R. It addresses the scarcity and dispersal of current SNA learning materials and seeks to provide a central, up-to-date source. The book's practical focus is on applying R tools rather than delving into theory, making it suitable for those ready to apply SNA techniques. It is openly written on GitHub using quarto, inviting community feedback through issues.
Go to Resource
Calculating and Analyzing Measures of Deprivation in the United States with deprivateR
deprivateR is an R package designed to provide a unified API for calculating and accessing various socioeconomic deprivation indices in the United States, such as the Area Deprivation Index (ADI), Neighborhood Deprivation Index (NDI), and Social Vulnerability Index (SVI), along with the Gini Coefficient. It offers a straightforward interface to compare indices across years and geographies, useful in research and public health. Though valuable, users should note some indices have limited validation for certain Census geographies. The package is available on CRAN and GitHub for easy installation and includes core functions like dep_get_index() and dep_calc_index() for computing deprivation scores using data like the American Community Survey.
Go to Resource
Convenience Functions for Working With Non-Calendar Years in R • acadyr
acadyr is an R package that simplifies the process of working with financial and academic years, which do not follow standard calendar cycles. It provides utility functions to create and manipulate these non-standard year types in R, such as financial_year and academic_year, which help in determining the year based on any given date. The package integrates smoothly with dplyr and ggplot2, and includes a vignette with examples of typical use cases, such as generating summary bar charts of revenues by financial year. While not available from CRAN, acadyr can be installed directly from GitHub.
Go to Resource

covdata
covdata is a data package for R that collects and bundles datasets related to the COVID-19 pandemic from a variety of sources.
Go to Resource
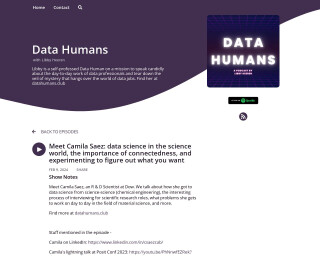
Data Humans Podcast
Libby Heeren is a self-professed Data Human on a mission to speak candidly about the day-to-day work of data professionals and tear down the veil of mystery that hangs over the world of data jobs. Find her at datahumans.club
Go to Resource
Data Pipelines with {targets}
This content introduces the 'targets' R package, designed to assist in creating reproducible and efficient data pipelines. 'targets' tracks each component of an analytical pipeline, updating steps only when changes occur and avoiding redundant computations. It facilitates clean, function-oriented code that significantly reduces frustration and time spent on re-running analyses due to errors or alterations in the code. The post includes a simple analysis example using the 'palmerpenguins' dataset, demonstrating how 'targets' can streamline the workflow. The analogy to The Eye of Sauron exemplifies its vigilant tracking capability.
Go to Resource
Data Science Resources
Data Science Resources is a carefully selected list of free tools and references for data science, maintained by Nicola Rennie. The repository allows community contributions; individuals can propose additions or modifications to the resource list by filing an issue or editing the 'resources.csv' file on GitHub, followed by submitting a pull request. This open-source approach ensures the collection remains up-to-date and comprehensive, benefiting data scientists at various levels of expertise looking for reliable references and tools.
Go to Resource