
Resources
This carefully curated collection of resources will help you find packages and learning resources to help you on your R journey.
Efficiency and Consistency: Automate Subset Graphics with ggplot2 and purrr - Cédric Scherer
Efficiency and Consistency: Automate Subset Graphics with ggplot2 and purrr is a blog post by Cédric Scherer that discusses automated plot generation with ggplot2. The post explains how to create a set of explorative or explanatory charts for different variables or categories of a dataset using a functional programming approach. It provides examples and tips for working with variables and explores data sets visually.
Go to Resource
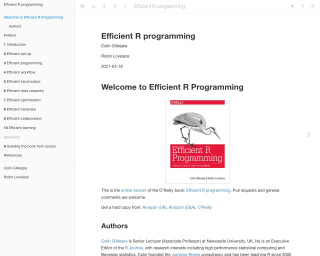
Efficient R Programming
Efficient R programming is a book that provides tips and techniques for writing efficient and optimized code in R.
Go to Resource
Enhance Quarto Project Workflows and Standards • froggeR
froggeR is an R package designed to enhance Quarto project workflows for R users. It provides a suite of functions that automate project setup tasks, enforce consistent documentation, and allow users to focus on analysis rather than configuration. The package includes features for creating Quarto projects with custom templates, managing YAML headers, applying git protection with a comprehensive .gitignore, styling documents with SCSS templates, and generating structured project documentation. It's particularly useful for R users managing multiple Quarto projects, encouraging collaboration, and standardizing project structures.
Go to Resource
Exploratory Data Analysis in R
This content details the process of Exploratory Data Analysis (EDA) using R. It emphasizes the importance of EDA as a crucial part of data science, particularly in understanding data and identifying biases. The article introduces several R packages that facilitate EDA, including overviewR, which is particularly focused on time series data analysis but is applicable to other data types. Key features of each package are compared, and the usage of the {palmerpenguins} dataset is illustrated. Package installation, data loading, and functions like str() and summary() are discussed, giving readers an introduction to effective data analysis in R.
Go to Resource
Flowcharts made easy with the package {flowchart}
The {flowchart} package in R facilitates the creation of flowcharts, particularly useful in health research to show participant flow in studies. It integrates with the tidyverse workflow, offering customizable functions that work with pipe operators. Unlike other packages, it adapts flowcharts automatically to the data, enhancing reproducibility. The post explains installation, initialization, and drawing processes using the SAFO clinical trial dataset. It's easy to produce complex flowcharts without manual parameter setting thanks to the package's tidyverse-centric design.
Go to Resource

Full-Stack Survey Research with SurveyMonkey • svmkR
svmkR is an R package that provides a comprehensive toolkit for managing SurveyMonkey surveys within the R programming environment. It enables users to create, upload, download, and analyze surveys directly from R. Users can calculate margins of error, apply statistical survey weights through raking, and generate SurveyMonkey-style banner presentations for polls. The package is installed from GitHub and serves as a full-stack survey research solution. The source is available on GitHub, and the package was developed by a team of contributors, building on the surveymonkey package by enhancing and refactoring it.
Go to Resource
How (and Why) I came to Use R for Data Analysis and Evaluation
Alberto Espinoza recounts his journey with R for data analysis and evaluation, marking his 10-year experience since first encountering R during his graduate assistantship. Initially clueless about R, he was tasked with assisting and leading statistics labs using R. Despite early challenges and a steep learning curve, he recognized R's power over software like SPSS or Excel. His continued use of R spanned graduate projects, market research, data preparation for Tableau, and Survey Monkey analysis. Espinoza outlines R's advantages: reproducibility, efficiency, clarity, and an extensive package ecosystem, underlining R's significance in his professional growth.
Go to Resource
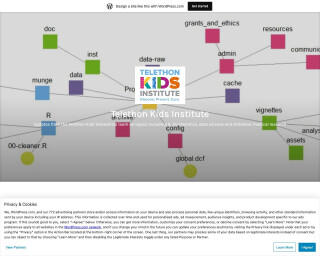
How Do You Organise Your R Project? This Is What We Do.
This blog post discusses how the Biometrics group at Telethon Kids Institute organizes their R projects using a standardized template project directory. The post covers the project directory structure, reproducible research practices, and the use of version control.
Go to Resource
How I’m using Claude Code to write R code
Simon P. Couch discusses his experiences using Claude Code to write R code, including initial impressions, subsequent reduced usage, and recent enhancements leading to more effective use. He highlights the importance of providing the model with adequate context to understand the project, through techniques such as creating a CLAUDE.md file with instructions and project-specific information. Couch details how incorporating the Model Context Protocol, slash commands, and external documentation improved his workflow. By facilitating model access to R package documentation and setting up an MCP server, he can now use Claude Code more efficiently for coding assistance.
Go to Resource
How to open a folder as a Positron project with macOS Quick Actions
Andrew Heiss provides a macOS Quick Action workflow for opening folders as projects in Positron directly from Finder. He details the challenges of transitioning from RStudio's Rproj files to Positron, which lacks an equivalent. To improve efficiency, Heiss introduces an 'Open in Positron' Quick Action and explains the concept of Positron workspaces. He compares them to Rproj files and discusses their pros and cons, offering insights into project-oriented workflows for Positron. Additional details include the integration of project switcher menus, recent project lists, and multi-root workspaces in Positron.
Go to Resource
Introducing Databot: An AI assistant for exploratory data analysis
Databot is an AI-powered assistant developed by Posit to augment the exploratory data analysis (EDA) capabilities of data scientists who use Python or R. This ambitious application of large language models (LLMs) aims to fast-track the EDA process, which conventionally takes hours, down to just minutes. Unlike autonomous or sandbox-constrained AI agents, Databot works interactively in a highly collaborative 'pair programming' style, engaging the user with rapid code-writing, execution, and analysis. It employs a cycle termed the 'WEAR loop' to ensure insights are reliable, serendipitous, and transparent. Databot remains a research preview exclusively available for Positron users.
Go to Resource

Keep your packages up-to-date with minimal hassle
{updateme} is an R package that enhances the library() function by displaying informative messages about the current status of loaded packages with respect to their latest versions. It supports packages installed from CRAN, Bioconductor, GitHub, and GitLab. The tool provides configurations for checking updates and can be easily integrated into the R startup process. The package also features caching mechanisms to improve performance and can be toggled on or off as needed. It's designed to help R users keep their packages up-to-date with minimal hassle.
Go to Resource