
Resources
This carefully curated collection of resources will help you find packages and learning resources to help you on your R journey.
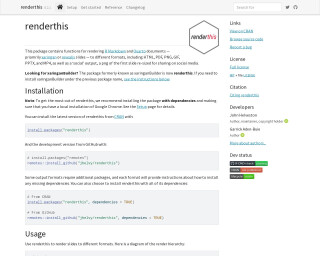
Render media to different formats • renderthis
The package 'renderthis' (formerly 'xaringanBuilder') enables users to render R Markdown and Quarto documents into various formats like HTML, PDF, PNG, GIF, PPTX, and MP4. It specifically caters to xaringan or revealjs slide presentations and includes a 'social' output optimized for sharing on social media. Installation requires dependencies and a local Google Chrome browser. It simplifies rendering with functions prefixed by to_*() requiring a source file path. Additional dependencies are needed for certain formats, with instructions provided for each case. The package supports an efficient workflow for preparing presentations for diverse sharing and publication purposes.
Go to Resource
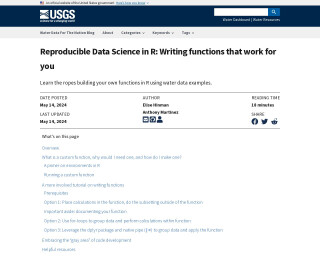
Reproducible Data Science in R: Writing functions that work for you
This blog post from the Water Data For The Nation Blog guides readers on crafting custom functions in R for reproducible data science, particularly with water-related data. Starting from the basics, it emphasizes the benefits like consistency, error reduction, and code shortening by avoiding repeated tasks. The post covers function essentials and environments in R, providing a step-by-step tutorial using the Water Quality Portal data. It prepares readers for advanced function usage in R, targeting those with basic programming experience aiming to advance their skills.
Go to Resource
resouRces
This content encompasses a comprehensive list of R-related educational materials, packages, tutorials, and datasets with projected dates ranging up to the year 2025. It includes various titles that focus on learning R programming, data analysis, data visualization, geospatial mapping, and statistical methods. Significant emphasis is placed on resources for learning R, such as introductions to R, books, courses, and video tutorials. Additionally, specific packages for data wrangling, statistical modeling, and visualization are mentioned, indicating the evolution and specialization of R's ecosystem to cater to diverse data science needs.
Go to Resource
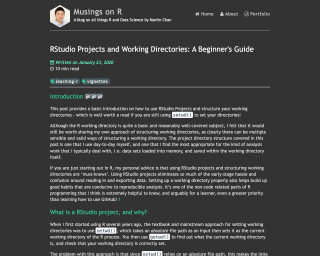
RStudio Projects and Working Directories: A Beginner's Guide
This blog post provides a basic introduction on how to use RStudio Projects and structure your working directories. It explains why RStudio projects are important and the advantages of using them over setwd(). The post also covers how RStudio projects make file paths relative, making it easier to reference files within the project. It includes practical examples and personal advice for beginners in R programming.
Go to Resource
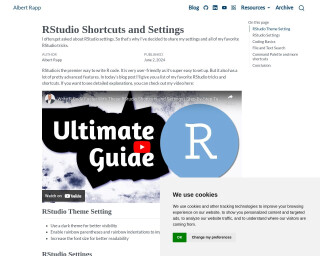
RStudio Shortcuts and Settings
Albert Rapp provides a guide for maximizing productivity in RStudio with shortcuts and settings. This post covers visual adjustments like themes, legibility improvements, and editor configurations, alongside tips for efficient code execution, debugging, and navigation. Rapp emphasizes starting with a clean environment, highlights key shortcuts for coding basics, file searching, command palette, and session management. The aim is to enhance user experience, reduce reliance on the mouse, and improve coding workflow. Ideal for R users looking to streamline their RStudio setup.
Go to Resource
RStudio to Positron
This overview is designed for current RStudio users considering a switch to Positron, a new IDE. It explains similarities between RStudio and Positron and highlights changes users can expect. By leveraging Code OSS, the same foundation as Visual Studio Code, Positron offers features tailored for data science. This guide, alongside additional resources, aims to ease the transition with a focus on keybindings, feature comparisons, and using Positron's user interface effectively. Tips include using the migration guide and exploring the Command Palette, a central element differing from RStudio's traditional layout.
Go to Resource
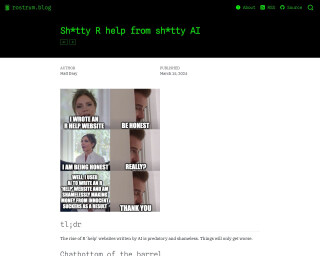
Sh*tty R help from sh*tty AI
The blog post from rostrum.blog critiques the proliferation of R help websites that use low-quality AI-generated content to exploit vulnerable learners for profit. The author observes these sites featuring predatory practices such as affiliate marketing without providing valuable help, producing numerous pages with slightly altered content for SEO gains, and dishonestly attributing authorship to non-existent human writers. The post warns readers to be cautious and recognize that these sites offer poor advice, often including incorrect or non-functional code, and may feature content pirated from legitimate creators without consent.
Go to Resource
Tips for debugging and cleaning broken code
This guide provides strategies for debugging and cleaning broken R code, specifically in a data visualization context using 'dplyr' and 'ggplot2'. It helps identify common mistakes in function chaining and plot layering, offering tips on how to spot and fix errors such as misspelled words or misplaced punctuation. The article illustrates the debugging process using an example with incorrect R code, followed by the corrected version. The guide emphasizes the importance of code formatting and reindenting for troubleshooting, making the debugging process less daunting.
Go to Resource
Using project scripts to keep Quarto source and output files organised
Pete Jones shares a tip for organizing Quarto project files, focusing on separating source (.qmd) and output (.pdf, .html) files when source files are stored in subdirectories. This is a particular challenge due to Quarto's default behavior of placing output files next to their source. The article discusses project-based workflows, the issues with Quarto subdirectories, and leverages Quarto features to solve the problem. A scripted solution is presented to ensure outputs are organized in a specified directory, maintaining a clean project structure even with source files in subdirectories.
Go to Resource
Using Quarto to Write a Book
Kieran Healy discusses revising his Data Visualization book using Quarto, a publishing system optimized for plain-text format and integrates code snippets in documents. The book focuses on data visualization with R and ggplot, detailing advantages and constraints of Quarto. It maintains scholarly elements automatically, such as numbered figures and references, enhancing reproducibility. Healy emphasizes the benefits of plain-text and version control for accuracy and multi-format outputs (PDF, HTML), noting Quarto's implementation of literate programming and extensions of tools like pandoc, Sweave, and RMarkdown/knitr.
Go to Resource
Using renv in R
The content is a blog post by Erik Gahner Larsen discussing the use of the 'renv' package in R for managing package dependencies and ensuring reproducibility in R projects. It highlights issues faced when R scripts fail due to package updates or system changes and presents 'renv' as a solution for creating isolated project environments with specific package versions. This ensures that R scripts remain functional over time by snapshotting and restoring package states, thus allowing others to run the code with the intended results, even if the R landscape changes.
Go to Resource
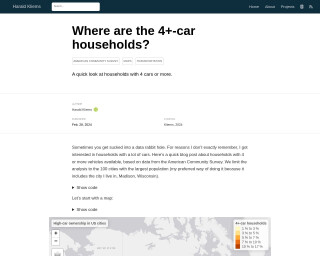
Where are the 4+-car households?
Harald Kliems investigates the prevalence of 4+-car households in the 100 most populous US cities using data from the American Community Survey. The blog post highlights the spatial distribution of such households and contrasts the top and bottom ten cities in terms of the percentage of 4+-car ownership. Key R packages used in the analysis include tidyverse, tidycensus, tigris, gt, and tmap. This examination into the facets of American car ownership is accompanied by visualizations such as maps and tables, enabling deeper insights into the data.
Go to Resource