
Resources
This carefully curated collection of resources will help you find packages and learning resources to help you on your R journey.

data.table
data.table provides a high-performance version of base R’s data.frame with syntax and feature enhancements for ease of use, convenience and programming speed.
Go to Resource
dplyr
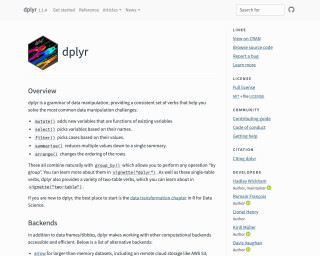
dplyr is a package in R that provides a grammar of data manipulation. It offers a consistent set of verbs to solve common data manipulation challenges, such as adding new variables, selecting variables, filtering cases, summarizing data, and arranging rows. It also provides support for working with different computational backends, including arrow, dtplyr, dbplyr, duckplyr, duckdb, and sparklyr. The package can be installed as part of the tidyverse or separately.
Go to Resource
dplyr 1.2.0
dplyr 1.2.0 is a major release of the popular data manipulation package in R. The update introduces new features like filter_out() as a complement to the existing filter() function, as well as when_any() and when_all() helpers. It also adds functions such as recode_values(), replace_values(), and replace_when() to extend the capabilities for recoding and replacing data. These improvements have been shaped by the tidyverse community's tidyups proposal process, and the announcement encourages users to install the update from CRAN. Alongside providing code examples, the importance of understandable and maintainable code when filtering data is emphasized.
Go to Resource
Duplicating Quarto elements with code templates to reduce copy and paste errors
This blog post from the Water Data For The Nation Blog demonstrates how to use Quarto code templates to create reproducible Quarto documents, such as reports and slideshows, with fewer errors. Using custom templates allows for the easy replication of code chunks, such as those producing statistical summaries or visualizations for different datasets. The example used is USGS streamgage data, with a focus on automating the creation of slideshows in Quarto's markdown format. Advanced topics like adding columns, tables, and speaker notes to PowerPoint slides via Quarto are also covered. Methods for iterating over data in a more efficient and less error-prone way than traditional copy and paste techniques are highlighted.
Go to Resource
Generating quarto syntax within R – Notes from a data witch
This blog post introduces 'quartose', an R package designed to integrate with Quarto for literate programming. The author, located in Sydney, discusses the nuances of names and their personal connection to this topic before exploring a data analysis task using the 'babynames' package. The analysis involves mapping names to data frames and visualizing name popularity over time. The post concludes with a demonstration of 'quarto_tabset()' that allows inserting plots or data frames into a document as a tabbed interface, enhancing the presentation of data in a readable and interactive format.
Go to Resource
Getting more out of dplyr
Video presentation by Suzan Baert on getting more out of dplyr at SatRday 2018 Amsterdam.
Go to Resource
Homelessness and Rents in Canada
This content is a comprehensive R code walkthrough for analyzing homelessness and rent data in Canada. It uses multiple R libraries, including the tidyverse for data wrangling, can census for accessing census data, and patchwork for visualizing data. Important steps include data import, cleaning, and transforming with functions like mutate, filter, and summarize. Quantile calculations for rents and adjustments for CPI are shown to assess real rents over time. It highlights metros like Vancouver and Toronto, using colors to represent different years. The code indicates a rich, data-driven analysis and visualization process focusing on socio-economic issues of homelessness and rents.
Go to Resource
How (and Why) I came to Use R for Data Analysis and Evaluation
Alberto Espinoza recounts his journey with R for data analysis and evaluation, marking his 10-year experience since first encountering R during his graduate assistantship. Initially clueless about R, he was tasked with assisting and leading statistics labs using R. Despite early challenges and a steep learning curve, he recognized R's power over software like SPSS or Excel. His continued use of R spanned graduate projects, market research, data preparation for Tableau, and Survey Monkey analysis. Espinoza outlines R's advantages: reproducibility, efficiency, clarity, and an extensive package ecosystem, underlining R's significance in his professional growth.
Go to Resource
How to Split Data into Equal Sized Groups in R: A Comprehensive Guide for Beginners
This guide instructs beginners on splitting data into equal-sized groups in R, essential for cross-validation and balanced datasets. Using the split() function, cut_number() from ggplot2, and group_split() from dplyr, it provides syntax and examples for various data types. Detailed explanations and practical examples aid in mastering data manipulation for model evaluation and analysis.
Go to Resource