
Resources
This carefully curated collection of resources will help you find packages and learning resources to help you on your R journey.
LA County Population Data Viz
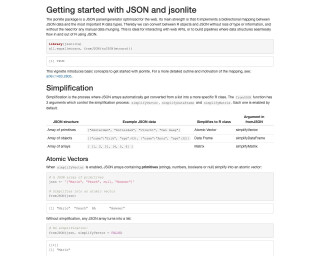
This content outlines a detailed example of accessing and visualizing population data for Los Angeles County using R programming language. It provides insights into the population size of LA County compared to the city proper and the greater metropolitan area. Additionally, the text includes R code that interacts with the U.S. Census Bureau API, demonstrating how to retrieve, filter, and arrange population estimates with county-level granularity and geometry data for mapping. The snippet focuses on data manipulation and visualization techniques using tidyverse and tidycensus, highlighting the practical application of these tools in demographic analysis.
Go to Resource
labelled
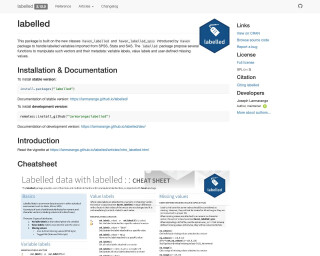
Manipulating Labelled Data is a package in R that provides functions for handling labelled variables imported from SPSS, Stata, and SAS. It allows for manipulation of variable labels, value labels, and user-defined missing values.
Go to Resource

Learning tidyselect
Learning tidyselect is a tutorial that covers various aspects of working with multiple columns using tidyselect in R. It explains the tidyselect selection helpers and how to use them with select(), where() and across(). It also provides examples and exercises to practice the concepts.
Go to Resource
Let's talk about joins
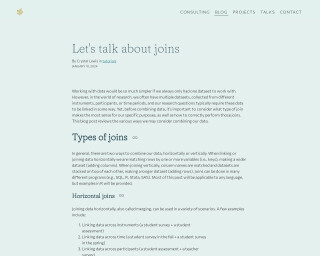
This content provides a tutorial by Crystal Lewis on how to perform joins in data analysis, both horizontal and vertical, using SQL, R, Stata, SAS, or other programs. It explains different types of joins such as left, right, full, and inner joins, and the scenarios in which they might be used, like linking data across instruments, time, or participants. Lewis further details two important rules for horizontal joins related to variable naming and keys, ensuring the proper merging of datasets without duplication or data loss.
Go to Resource
Leveraging labelled data in R
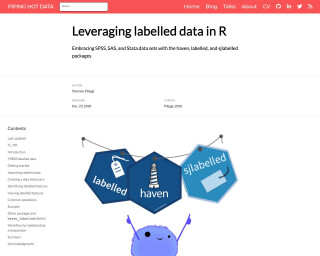
This blog post discusses how to leverage labelled data in R using the haven, labelled, and sjlabelled packages. It covers importing labelled data, creating a data dictionary, identifying labelled features, and common operations with labelled data. The post also provides an example and mentions other packages and workflow for labelled data manipulation.
Go to Resource
Listening to complex tones using sine waves and toneR
The post details an experiment with auditory perception by converting chord patterns into complex tones through programming. Matt Crump describes using the R package {toneR} to synthesize chords as sums of sine waves at varying frequencies and amplitudes, resulting in complex tonal renderings. Initial code examples involve AI model 'Dreamshaper' generating art from prompts, with a musical focus. Subsequently, the tutorial shifts to R code for audio synthesis and processing. This exploration rekindles the author's previous academic work on complex tones and their perceptual effects, inviting readers to join in the auditory experiment.
Go to Resource
Lotas - AI for RStudio | Rao Code Editor
Rao Code Editor by Lotas is an AI-powered tool designed to enhance the RStudio workflow. It offers an intelligent code editor that understands project files and data, enabling it to generate and edit code efficiently. Rao writes R scripts and R markdown files, fixes errors, and improves analyses. It also comprehensively analyzes output, including console results and data visualizations, providing suggestions and insights into the code's implications. Available with a free tier, Rao aims to streamline the coding process for RStudio users.
Go to Resource
Mapping water insecurity in R with tidycensus
This content provides a comprehensive guide on utilizing the tidycensus package in R to map water insecurity based on American Community Survey data. It elaborates on setting up the tidycensus environment, exploring Census Bureau variables, and performing data processing. Techniques like data visualization with tigris and sf packages are also covered. The tutorial highlights differences in plumbing facilities and compares population versus plumbing access across Western U.S. counties. With practical code examples, it aids readers in understanding and visualizing the spatial variation of social vulnerability indicators affecting water insecurity.
Go to Resource
Modern Data Science with R
Modern Data Science with R is a comprehensive data science textbook that incorporates statistical and computational thinking to solve real-world problems with data. It covers topics such as data wrangling, data visualization, inferential statistics, and more. The book is currently in its 3rd edition and includes updates and changes to reflect the evolving R ecosystem. It also provides instructor resources, reviews, and errata on its website.
Go to Resource
naniar
naniar provides principled, tidy ways to summarise, visualise, and manipulate missing data with minimal deviations from the workflows in ggplot2 and tidy data.
Go to Resource