
Resources
This carefully curated collection of resources will help you find packages and learning resources to help you on your R journey.
unheadr
unheadr is an R package that helps wrangle data when it has embedded subheaders or broken values. It provides functions to untangle embedded subheaders and fix values that are broken across multiple rows.
Go to Resource
Use SAS, R, and quarto together with sasquatch
sasquatch is a package that allows the integration of SAS, R, and Quarto to create reproducible multilingual reports. The package facilitates running SAS code blocks, managing data and files across SAS and R, and rendering outputs within Quarto or R Markdown documents. It also provides functionalities for installing dependencies like Python's SASPy, configuring SAS, especially for SAS On Demand for Academics, and managing Quarto document templates for seamless integration with SAS output. Users can pass data between R and SAS, execute code blocks interactively, and render polished documents with familiar SAS styles.
Go to Resource
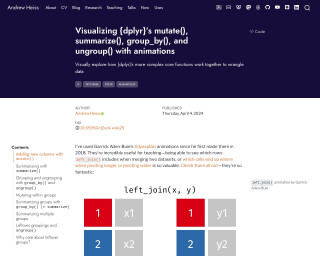
Visualizing {dplyr}’s mutate(), summarize(), group_by(), and ungroup() with animations
Andrew Heiss explores {dplyr} functions like mutate(), summarize(), group_by(), and ungroup() through handmade animations. Heiss illustrates the complexities of data manipulation workflow steps that are not immediately obvious when performing operations like adding new columns or summarizing data. This tutorial helps conceptualize the impact of these functions on data frames by visualizing their behind-the-scenes mechanics. The animations serve as an effective teaching tool to demystify what happens to data during different stages of the tidyverse's split/apply/combine paradigm, using handcrafted illustrations to make the learning process more intuitive.
Go to Resource
Vizualizing global testosterone levels by country
This article by Aspire Data Solutions outlines the process of web scraping testosterone levels for different countries from the World Population Review website and creating a choropleth map to visualize the data in R. It demonstrates how to gather, clean, and plot geographical data, cautioning that this ecological dataset is approximate, not age-standardized, and should be used for identifying patterns rather than for precise comparisons or causal inferences. The author, Mihiretu Kebede (PhD), also includes code snippets and explanations for the R packages used.
Go to Resource
Welcome to ModernDive (v2) | Statistical Inference via Data Science
ModernDive (v2) is the website for 'Statistical Inference via Data Science: A ModernDive into R and the Tidyverse (Second Edition)'. It showcases updates from the first edition, which is available online and for purchase. The book, authored by Chester Ismay, Albert Y. Kim, and Arturo Valdivia, teaches R and data science concepts. It's scheduled for print by CRC Press in 2025 and is licensed under Creative Commons. Readers can contribute on GitHub and anticipate a resource-rich approach to stats with a focus on tidyverse tools for data analysis.
Go to Resource
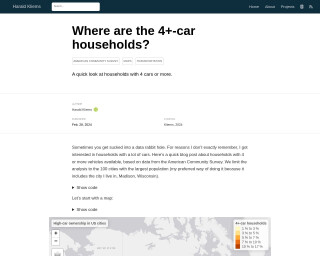
Where are the 4+-car households?
Harald Kliems investigates the prevalence of 4+-car households in the 100 most populous US cities using data from the American Community Survey. The blog post highlights the spatial distribution of such households and contrasts the top and bottom ten cities in terms of the percentage of 4+-car ownership. Key R packages used in the analysis include tidyverse, tidycensus, tigris, gt, and tmap. This examination into the facets of American car ownership is accompanied by visualizations such as maps and tables, enabling deeper insights into the data.
Go to Resource
Which names that are also names of countries are most common?
Simon P. Couch's blog post investigates which names that are also names of countries are most popular in the United States from 1880 to 2017. The post details the process of using R and packages like 'babynames' and 'countrycode' to filter and analyze baby name data. It offers a glimpse into the results, revealing the top country-names and their trends over time. Readers are encouraged to guess the most common names before seeing the data-driven answer. The post concludes with interesting visualizations showing the historical trends for the top country-names.
Go to Resource
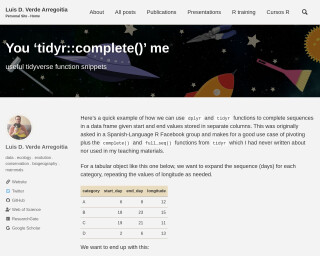
You ‘tidyr::complete()’ me
Luis D. Verde Arregoitia's article demonstrates using the 'complete()' function from the tidyr package to expand a data frame's sequences based on start and end values within columns. The example showcases how to pivot data and use 'complete()' and 'full_seq()' functions for filling in sequences of days for different categories, while repeating longitude values accordingly. This technique is useful for managing tabular data in wide format, facilitating transformations into a long format ready for analysis. The article is instructional for those working with R in ecology, conservation, and biogeography, focusing on data wrangling challenges.
Go to Resource