
Resources
This carefully curated collection of resources will help you find packages and learning resources to help you on your R journey.
Outliers in Data Analysis: Detecting Extreme Values Before Modeling in R
This content provides a comprehensive guide on detecting outliers in data analysis before modeling using R, with a specific focus on Airbnb listings data from Istanbul. It emphasizes the importance of understanding the statistical implications of outliers and how they can distort statistical analysis and modeling efforts. The guide demonstrates practical outlier detection methods and includes R code for loading and pre-processing the Airbnb dataset, while also discussing relevant statistical concepts and the importance of making informed preprocessing decisions. Example variables such as price, minimum_nights, and room_type are used for illustration.
Go to Resource
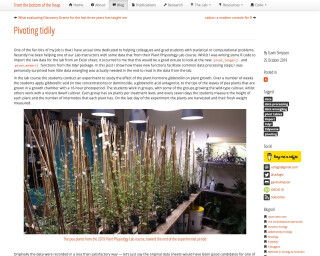
Pivoting tidily
This post discusses the new pivot_longer() and pivot_wider() functions from the tidyr package in R. It demonstrates how these functions can facilitate common data processing steps and reduce the need for extensive data wrangling. The post uses an example from a Plant Physiology Lab course to illustrate the use of these functions.
Go to Resource
purrr
Purrr is a package in R that enhances functional programming (FP) toolkit by providing a complete and consistent set of tools for working with functions and vectors.
Go to Resource
R for Data Science (2e)
R for Data Science (2e) is a comprehensive guide to performing data science tasks with R. It covers how to import, structure, transform, and visualize data while teaching best practices in data cleaning, plotting, and more. The book promotes literate programming and reproducible research to streamline work. It supports cognitive resource management for data wrangling and exploration. The content is freely available under the CC BY-NC-ND 3.0 License, with an option to support kākāpō conservation. Physical copies can be ordered on Amazon, and solutions to exercises are provided online.
Go to Resource
R for Journalists
This is a resource for journalists to learn how to use the R programming language for data analysis and reporting. It covers topics such as installing R and RStudio, importing/exporting data, data wrangling, data visualization, spatial analysis, publishing with RMarkdown, and using Git for version control. The tutorials are designed to help journalists quickly analyze data and report their findings.
Go to Resource

R for Sign Language Linguistics
This content is a tutorial by Carl "Calle" B{"o}rstell on leveraging R for sign language linguistics, published on August 17, 2023. It targets sign language linguists who are familiar with R, mentioning helpful resources and focusing on handling ELAN files (.eaf) using the {tidyverse} and custom functions in R. The tutorial introduces the {signglossR} package and the read_elan() function for importing ELAN files into R for data analysis, and details steps for reading, storing, and pivoting ELAN annotation data into wide format, with examples provided.
Go to Resource
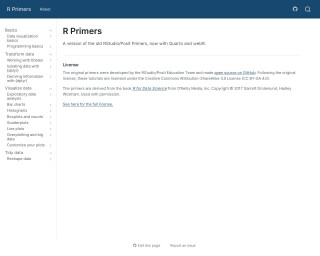
R Primers
R Primers offer updated RStudio/Posit educational content, now utilizing Quarto and webR. Originally developed by RStudio/Posit Education Team, these open-source tutorials help users learn R programming, deriving content from the book 'R for Data Science'. They are licensed under the CC BY-SA 4.0, ensuring wide accessibility for learners to improve their data science skills with R.
Go to Resource
R Workshop: Handling Uncertainty in your Data
This R Workshop titled 'Handling Uncertainty in your Data' is designed to educate participants on managing data uncertainty. Organized by Dr. Mario Reutter and Juli Nagel, and sponsored by IGOR, the workshop spans two afternoons with sessions on R basics, measurement precision theory, and practical techniques for computing confidence intervals and uncertainty visualization in R. Additionally, it provides a general intro to R, data wrangling, and visualization, with a spotlight on translating measurement precision into visual representations.
Go to Resource

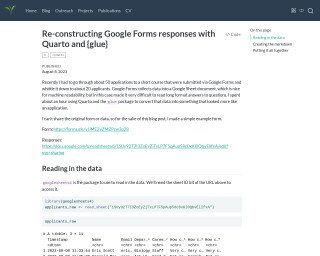
Re-constructing Google Forms responses with Quarto and {glue}
This blog post by Eric R. Scott explains how to use Quarto and the {glue} R package to transform Google Forms responses into a more readable application format. Initially dealing with a Google Sheet that collated 50 applicants' data for a short course, Scott outlines the process of converting cumbersome, lengthy answers into clean, application-like documents. The use of the {googlesheets4} package to import data and the manipulation of column names with {janitor} and {stringr} are detailed. Key to the transformation is utilizing Quarto's 'asis' output chunk option alongside {glue} to programmatically create markdown from the dataset.
Go to Resource

Recreate Some SAS® Procedures in R Using {procs}
The R package 'procs' replicates commonly used SAS procedures, targeting functions like PROC FREQ, PROC MEANS, PROC TTEST, and PROC REG. It simplifies the transition for SAS users to R by providing familiar functionality and outputs. This includes rich reporting outputs similar to SAS, pre-validated results to ensure fidelity with SAS outputs, ease of adoption for existing SAS users, and stability to maintain backward compatibility. The package includes data manipulation functions and aims to help save time in statistical results comparison and reporting.
Go to Resource
resouRces
This content encompasses a comprehensive list of R-related educational materials, packages, tutorials, and datasets with projected dates ranging up to the year 2025. It includes various titles that focus on learning R programming, data analysis, data visualization, geospatial mapping, and statistical methods. Significant emphasis is placed on resources for learning R, such as introductions to R, books, courses, and video tutorials. Additionally, specific packages for data wrangling, statistical modeling, and visualization are mentioned, indicating the evolution and specialization of R's ecosystem to cater to diverse data science needs.
Go to Resource