
Resources
This carefully curated collection of resources will help you find packages and learning resources to help you on your R journey.
Creating your personal website using Quarto
This document by Sam Shanny-Csik offers an introductory guide to creating personal websites using Quarto. It covers the basics of Quarto as a multipurpose publishing system built on Pandoc and how it integrates with languages like R, Python, and Julia for dynamic content creation. The tutorial explains the similarities and differences between RMarkdown and Quarto Markdown files, provides tips for code chunk execution, and guides readers through deploying their Quarto website using GitHub Pages. Additionally, it encourages exploring further resources on Quarto and the possibility of using other R-based tools or HTML templates for website creation.
Go to Resource
Duplicating Quarto elements with code templates to reduce copy and paste errors
This blog post from the Water Data For The Nation Blog demonstrates how to use Quarto code templates to create reproducible Quarto documents, such as reports and slideshows, with fewer errors. Using custom templates allows for the easy replication of code chunks, such as those producing statistical summaries or visualizations for different datasets. The example used is USGS streamgage data, with a focus on automating the creation of slideshows in Quarto's markdown format. Advanced topics like adding columns, tables, and speaker notes to PowerPoint slides via Quarto are also covered. Methods for iterating over data in a more efficient and less error-prone way than traditional copy and paste techniques are highlighted.
Go to Resource
Easily download files from the Open Science Framework with Papercheck
The 20% Statistician is a blog focusing on statistics, research methods, and open science. It aims to help researchers understand crucial statistical concepts, claiming that grasping 20% of statistics can improve 80% of inferences. A recent post highlights the challenge of downloading files from the Open Science Framework (OSF). The authors, DeBruine and Lakens, introduced 'Papercheck,' an R package with a function 'osf_file_download' that simplifies this process. Papercheck recreates OSF's folder structure within a local directory, making it user-friendly to access project files for review or reuse.
Go to Resource
flair
flair is an R package that provides tools for formatting R code in knitted R Markdown files.
Go to Resource
Generating quarto syntax within R – Notes from a data witch
This blog post introduces 'quartose', an R package designed to integrate with Quarto for literate programming. The author, located in Sydney, discusses the nuances of names and their personal connection to this topic before exploring a data analysis task using the 'babynames' package. The analysis involves mapping names to data frames and visualizing name popularity over time. The post concludes with a demonstration of 'quarto_tabset()' that allows inserting plots or data frames into a document as a tabbed interface, enhancing the presentation of data in a readable and interactive format.
Go to Resource
Happy 18th birthday ggplot2!
This content celebrates the 18th birthday of the data visualization package ggplot2, created by Hadley Wickham. It illustrates the significance and widespread appreciation of ggplot2 within the data science community through comments and reactions from various users. Comments highlight how ggplot2 has revolutionized the creation of data plots in R, and the playful puns acknowledge the package's 'maturity' with references to drinking age and bar charts. The community expresses gratitude towards Wickham and his team for their contributions to the R ecosystem.
Go to Resource
Hillshade effects
Dr. Dominic Royé's blog post on hillshade effects explains creating relief maps in R with shadow effects to generate visual depth. He uses several R packages, including 'sf' for vector data, 'elevatr' for elevation API access, 'terra' for raster manipulation, 'whitebox' for geospatial analysis, and 'ggplot2' extensions for scales and color blending. The tutorial covers installing packages, importing and filtering lake boundaries, and manipulating Digital Elevation Models (DEMs) for Switzerland, with reproducible R code snippets.
Go to Resource
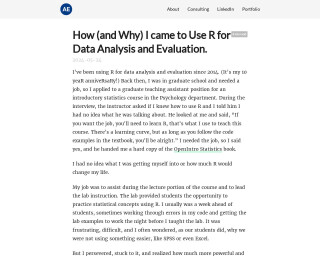
How (and Why) I came to Use R for Data Analysis and Evaluation
Alberto Espinoza recounts his journey with R for data analysis and evaluation, marking his 10-year experience since first encountering R during his graduate assistantship. Initially clueless about R, he was tasked with assisting and leading statistics labs using R. Despite early challenges and a steep learning curve, he recognized R's power over software like SPSS or Excel. His continued use of R spanned graduate projects, market research, data preparation for Tableau, and Survey Monkey analysis. Espinoza outlines R's advantages: reproducibility, efficiency, clarity, and an extensive package ecosystem, underlining R's significance in his professional growth.
Go to Resource
How to create CUSTOM Callout Boxes in Quarto - YouTube
This video tutorial demonstrates how to create custom callout boxes in Quarto, a document authoring system in R. Quarto allows you to customize your callout boxes to make your documents visually appealing and informative.
Go to Resource

How to Make Slides in R Using xaringan
A tutorial on how to make slides in R using xaringan
Go to Resource