
Resources
This carefully curated collection of resources will help you find packages and learning resources to help you on your R journey.
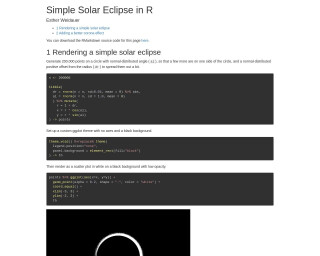
Simple Solar Eclipse in R
The tutorial 'Simple Solar Eclipse in R' by Esther Weidauer explains how to render a simple solar eclipse using R and ggplot2. It begins with generating points on a circle to simulate the moon's disk and then proceeds to add a corona effect, simulating the sun's atmosphere seen during an eclipse. Adjustments are made for a more realistic corona by creating subsets of points, assigning unique identifiers, and layering to produce the final visual effect. RMarkdown for the demo is available for download, encouraging users to try their hand at this elegant astronomical depiction.
Go to Resource
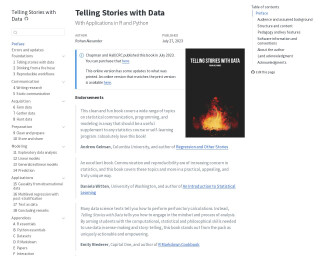
Telling Stories with Data
Telling Stories with Data by Rohan Alexander is a comprehensive guide on communicating insights effectively using data in R and Python. Published by Chapman and Hall/CRC, the book is endorsed by experts for its unique approach in emphasizing statistical communication, programming, and modeling. It covers the entire data science workflow, including data acquisition, analysis, and reproducibility, making it an excellent resource for statistics courses or self-learning. It focuses on developing the computational and philosophical skills necessary for sense-making and telling stories with data, making it a valuable tool for data scientists and analysts.
Go to Resource
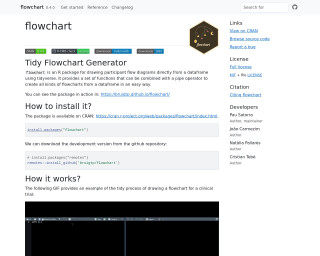
Tidy Flowchart Generator
The Tidy Flowchart Generator, or the 'flowchart' package, is an R package designed for drawing participant flow diagrams directly from a dataframe, employing the tidyverse syntax. It offers a suite of functions that utilize the pipe operator to generate flowcharts conveniently and flexibly from dataframes. The package is accessible through CRAN and can be installed traditionally or via the development version on GitHub. The process of creating a flowchart with this tool is demonstrated through a GIF example on its homepage, showcasing its usefulness in drafting flow diagrams for clinical trials or similar studies.
Go to Resource
Time-aware isochrones for accessibility mapping with R and Mapbox tools
This article discusses creating time-aware isochrones to analyze accessibility at different times of the day using R and Mapbox tools. It demonstrates how to work with traffic data and visualize the impact of traffic using Mapbox's predicted traffic data. The tutorial includes step-by-step instructions and code snippets for generating isochrones for specific addresses at different times, and visualizing them interactively on a map with a comparison slider to highlight the accessibility differences at noon versus rush hour. The tools discussed are the R packages mapboxapi and mapgl.
Go to Resource
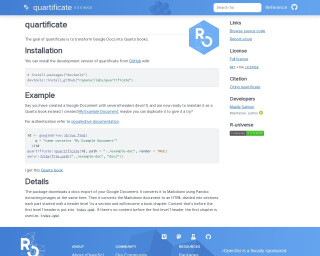
Transform Google Docs into Quarto Books with {quartificate}
The 'quartificate' package is designed to convert Google Documents into Quarto books, facilitating the transition from a simple document to a structured and maintainable book format. It streamlines the process by exporting the document into a Docx file, converting it to Markdown via Pandoc, and then sectioning it into HTML chapters based on header levels. This enables users to easily manage and render their content as a Quarto book. The package also provides seamless integration with Googledrive for authentication and document retrieval, and offers a quick start to render and view the book using the 'servr' package.
Go to Resource
Use meta shortcode variables with Quarto Includes to insert precise content - Posit
This blog post by Ashley Henry at Posit discusses how to use meta shortcode variables with Quarto Includes to ensure precise content insertion in your documentation. It delves into the benefits of using Quarto, a system for technical writing that enhances the insertion process by allowing for better customization and modularity. The post is targeted at users who are involved in the documentation process and are looking for methods to optimize content consistency while maintaining flexibility. Ashley Henry also shares her expertise from her time in the Navy and at Posit, where she focuses on clear and effective documentation.
Go to Resource
Use SAS, R, and quarto Together • sasquatch
sasquatch is an R package that enables the integration of SAS, R, and Quarto for creating reproducible multilingual reports. It utilizes SASPy and reticulate to run SAS code blocks within R, transfer data between SAS and R, perform SAS client file management, and render SAS output in quarto documents. The package includes installation instructions for development version, Python, and SASPy. It offers functionality such as interactive execution of SAS code, data conversion between R and SAS, and rendering quarto documents with SAS output, distinguishing it from similar packages like sasr, configSAS, and SASmarkdown.
Go to Resource
Use SAS, R, and quarto together with sasquatch
sasquatch is a package that allows the integration of SAS, R, and Quarto to create reproducible multilingual reports. The package facilitates running SAS code blocks, managing data and files across SAS and R, and rendering outputs within Quarto or R Markdown documents. It also provides functionalities for installing dependencies like Python's SASPy, configuring SAS, especially for SAS On Demand for Academics, and managing Quarto document templates for seamless integration with SAS output. Users can pass data between R and SAS, execute code blocks interactively, and render polished documents with familiar SAS styles.
Go to Resource
Using project scripts to keep Quarto source and output files organised
Pete Jones provides a tip for managing Quarto projects where the user wants to separate source (.qmd files) and output (.pdf, .html, etc.) files, especially when source files are in a subdirectory. The article addresses the problem that arises when Quarto's default settings place rendered output next to source files, which can create organizational issues in projects. The article intends to show how to overcome this by leveraging Quarto's features to keep files neatly organized within project subdirectories.
Go to Resource
Using project scripts to keep Quarto source and output files organised
Pete Jones shares a tip for organizing Quarto project files, focusing on separating source (.qmd) and output (.pdf, .html) files when source files are stored in subdirectories. This is a particular challenge due to Quarto's default behavior of placing output files next to their source. The article discusses project-based workflows, the issues with Quarto subdirectories, and leverages Quarto features to solve the problem. A scripted solution is presented to ensure outputs are organized in a specified directory, maintaining a clean project structure even with source files in subdirectories.
Go to Resource
Welcome to ModernDive (v2) | Statistical Inference via Data Science
ModernDive (v2) is the website for 'Statistical Inference via Data Science: A ModernDive into R and the Tidyverse (Second Edition)'. It showcases updates from the first edition, which is available online and for purchase. The book, authored by Chester Ismay, Albert Y. Kim, and Arturo Valdivia, teaches R and data science concepts. It's scheduled for print by CRC Press in 2025 and is licensed under Creative Commons. Readers can contribute on GitHub and anticipate a resource-rich approach to stats with a focus on tidyverse tools for data analysis.
Go to Resource
Which names that are also names of countries are most common?
Simon P. Couch's blog post investigates which names that are also names of countries are most popular in the United States from 1880 to 2017. The post details the process of using R and packages like 'babynames' and 'countrycode' to filter and analyze baby name data. It offers a glimpse into the results, revealing the top country-names and their trends over time. Readers are encouraged to guess the most common names before seeing the data-driven answer. The post concludes with interesting visualizations showing the historical trends for the top country-names.
Go to Resource