
Resources
This carefully curated collection of resources will help you find packages and learning resources to help you on your R journey.
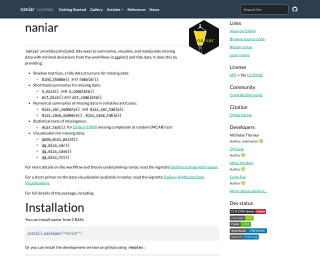
naniar
naniar provides principled, tidy ways to summarise, visualise, and manipulate missing data with minimal deviations from the workflows in ggplot2 and tidy data.
Go to Resource
Neon Ghosts with ggplot2
This content details Dr. Mowinckel's Halloween-themed tutorial on creating neon ghosts using the ggplot2 package in R. The tutorial provides a step-by-step guide with accompanying code to generate randomized ghost shapes and add neon glows for a spooky effect. Different neon colors are used for multiple ghost illustrations, and the code includes a function for plotting simple ghosts with variable sizes and wiggles. The blog also mentions a method to cite the work, indicating the author's intent for users not just to learn but also to use and reference the generated graphics.
Go to Resource
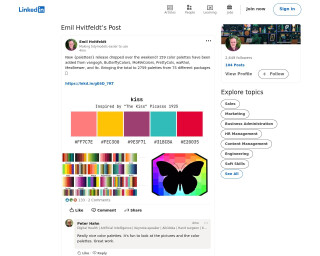
New {paletteer} release dropped over the weekend! 159 color palettes have been added
The content discusses Emil Hvitfeldt's LinkedIn post about a new release of the {paletteer} R package, which added 159 color palettes, bringing the total to 2759 palettes from 75 packages. It highlights the usefulness and aesthetic appeal of the palettes as articulated by community members, demonstrating the package's positive reception and usage within data visualization in R.
Go to Resource

New features in {gt} package
The blog post highlights the new features introduced in {gt} 0.10.0, a package for creating tables in R. Developed by Posit, formerly RStudio, the update includes novel functionalities like nanoplots and units notation. Rich Iannone, a software engineer at Posit, outlines these enhancements. He's known for his work on R packages like {gt} and {blastula} and his contributions to the Quarto project. His talk of exploration and adventure reflects his passion beyond coding. The article encourages subscribing for more insightful open-source data science content.
Go to Resource
New, work-in-progress book on spatial data visualization in R
This is an announcement of a work-in-progress book titled Spatial Data Visualization with tmap: A Practical Guide to Thematic Mapping in R, to be published on October 14, 2025. The book is designed for various levels of expertise, from beginners to experienced GIS users and covers the usage of the tmap package in R for creating thematic maps. The online version is currently available, with the first three parts mostly complete, and further chapters in development. The tmap package has seen significant updates in version 4.0, adding features like improved defaults and expanded faceting options. The book is part of the geocompx project.
Go to Resource
Nightlife of Barcelona Neighborhoods
The blog post by Jose M Sallan provides an in-depth spatial analysis of nightlife within the neighborhoods of Barcelona. It builds on the author's previous district-level analysis to evaluate neighborhoods based on the number and density of venues. The post includes choropleth maps and data wrangling examples. To perform the analysis, it uses sf for spatial analysis, with data sourced from BAdatasetsSpatial. The author also utilizes the tidyverse and kableExtra packages for data manipulation, plotting, and creating tables. The post showcases code snippets for loading, processing, and presenting geographical information, as well as generating and interpreting maps.
Go to Resource
Notes from a data witch - Four ways to write assertion checks in R
Learn about four different approaches to writing assertion checks in R to ensure code fails loudly and throws an error when assumptions are violated.
Go to Resource
Notes from a data witch - Four ways to write assertion checks in R
This article discusses the importance of writing assertion checks in R to ensure code fails loudly and throws an error when assumptions are violated. It explores four different approaches to writing assertions in R, with examples and explanations.
Go to Resource
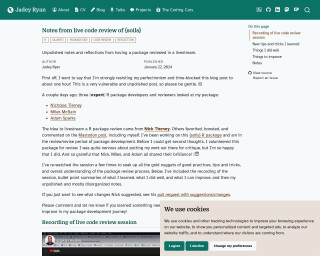
Notes from live code review of {soils} package
Jadey Ryan reflects on the value of having their R package, {soils}, reviewed live by expert R developers. The post includes candid thoughts on the process, emphasizes the importance of community feedback, and shares learning points such as good practices in R package development, defensive programming, and the use of specific R functions. It includes a recording of the review, insights on doing well and areas for improvement, and a mix of technical details relevant to R package development.
Go to Resource
Object-Oriented Diagram Plots with ggplot2 • ggdiagram
The 'ggdiagram' package enhances the ggplot2 ecosystem by providing tools for creating object-oriented diagrams in R. Inspired by the TikZ LaTeX system, 'ggdiagram' integrates with ggplot2 through additional functions, such as 'annotate' extensions, leveraging other packages like 'ggtext', 'ggforce', and 'ggarrow'. It's not a substitute for standard ggplot2 functions but complements them for designing interrelated visual objects. Installation instructions include CRAN and R-universe options. Examples demonstrate creating and connecting geometric shapes, with the result formatted in a ggplot style suitable for data visualization and diagrammatic illustrations.
Go to Resource
officedown
officedown is an R package that enhances the formatting of Microsoft Word and PowerPoint documents produced by R Markdown. It provides features such as compatibility with the functions of the package officer, the ability to use table styles and list styles defined in a Word template, and support for flextable output. officedown also enhances PowerPoint productions by providing a mechanism for placing results according to a slide template contained in the PowerPoint document. For more information, refer to the package documentation.
Go to Resource