
Resources
This carefully curated collection of resources will help you find packages and learning resources to help you on your R journey.

lubridate
Lubridate makes working with date-time data easier in R. It provides intuitive commands for parsing and manipulating date-times, handles time zones and other quirks, and expands the types of mathematical operations that can be performed with date-time objects. This resource provides an overview of lubridate, installation instructions, a cheatsheet of its features, and information about its code of conduct.
Go to Resource
Make simpler working with environmental data products • tidypollute
tidypollute is an R package designed to streamline the process of working with EPA AirData flat files and AQS API for environmental data analysis. Developed by Dr. Nelson Roque, the package provides tools for importing, cleaning, analyzing, and visualizing large-scale air pollution datasets. It's built with the tidyverse ethos, ensuring tidy and efficient data handling. Key features include processing EPA data files, extracting Atmotube Cloud API data, and soon to be added are real-time API queries, quick visualization tools, documentation generation, and demographic data integration.
Go to Resource
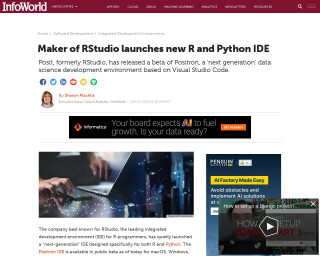
Maker of RStudio launches new R and Python IDE
Posit, previously known as RStudio, released a beta version of its new integrated development environment (IDE) called Positron. Tailored for data science, Positron supports both R and Python programming languages and is based on Visual Studio Code. It simplifies setup for R and Python without needing additional extensions, unlike standard VS Code. Positron includes built-in features like a data explorer for viewing and interacting with data frames. It is available on macOS, Windows, and Linux and integrates with the OpenVSX registry for extensions, highlighting Posit's support for OpenVSX. The IDE emphasizes a code-first approach with additional tools to aid data examination.
Go to Resource
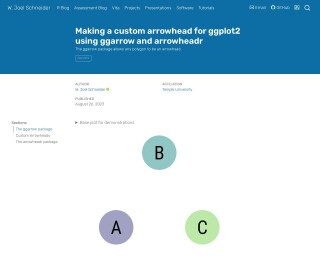
Making a custom arrowhead for ggplot2 using {ggarrow} and {arrowheadr}
This content appears to be a snippet demonstrating how to use the ggarrow package in R to create custom arrow geoms in ggplot2. It shows code examples for generating plots with different types of arrows, like open arrows, closed arrows, latex' arrows similar to TikZ, sharp barbs, feathers, kite arrowheads, and more. It includes instructions on how to adjust the arrow properties such as angle, length, sharpness, and resection. The text also compares the ggplot2 default arrows with those available in TikZ and emphasizes the flexibility provided by the ggarrow package.
Go to Resource
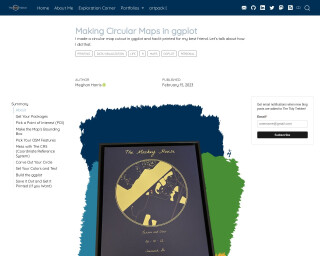
Making Circular Maps in ggplot
Meggan Harris wrote a blog post on how to create circular maps using R and ggplot2. The post describes the experience of the author as she traveled extensively in 2022 and decided to create a personalized wedding gift map for her friend. The post details the necessary R packages, picking a point of interest, and how to obtain latitude and longitude points for mapping. The author also shares code snippets for creating maps with simple features and making them look pleasing with special fonts and aesthetics. The code for the project is shared on GitHub for those who want to skip the reading.
Go to Resource
Making Middle Earth maps with R | Andrew Heiss
Andrew Heiss shares his experience in creating Middle-Earth maps using R in this educational blog post. He introduces readers to the {sf} package and demonstrates how to work with shapefiles for GIS-related visualization in {ggplot2}. Heiss, a fan of J. R. R. Tolkien, merges his expertise in data visualization with his love for Tolkien's world, offering a fun approach to learning spatial data manipulation and visualization techniques. He provides a beginner-friendly explanation of geographic data concepts and guides readers through the process of creating maps with R, using shapefiles of Middle Earth as a case study.
Go to Resource
Making Middle Earth maps with R | Andrew Heiss
This blog post by Andrew Heiss provides a tutorial on how to make Middle Earth maps using R and ggplot. It covers the use of the sf package for working with geographic data and shapefiles, as well as demonstrating data visualization tricks.
Go to Resource
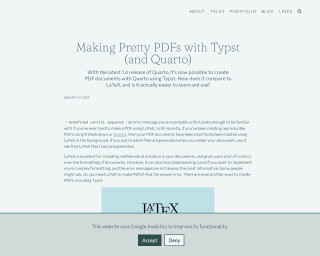
Making Pretty PDFs with Typst (and Quarto)
Nicola Rennie's article explores the benefits of the new Typst system for creating PDFs with Quarto. Typst is an alternative to LaTeX that aims to be easier to learn and more user-friendly. The article provides a guide on how to use Typst with Quarto, including setting the formatting and creating custom styles. It addresses the challenges of learning Typst by sharing personal experiences and comparing code snippets between Typst and LaTeX. The focus is on enhancing the appearance of PDF documents while maintaining reproducibility and control over the formatting.
Go to Resource

mapdeck
An R library for plotting large datasets on interactive maps using Mapbox GL and Deck.gl
Go to Resource
Mapping Antarctica
The blog post 'Mapping Antarctica' outlines the process of creating clean orthographic maps of Antarctica in R, overcoming challenges presented by polar projections and the International Date Line. The author provides a detailed tutorial to manually correct the GISCO Antarctica shapefile and eliminate projection artifacts. Using R libraries such as tidyverse, sf, and giscoR, the post guides readers through identifying and fixing geometry issues, ultimately producing a refined and accurate map visualizing the Antarctic territory.
Go to Resource
Mapping building use with a hexagonal grid
Dr. Dominic Royé demonstrates how to visualize building use distribution across Spain via a 20 km hexagonal grid. The process involves aggregating 100 m building-use rasters into hexagons, to depict land use like agricultural, industrial, and commercial purposes. Hexagons are chosen for spatial analysis to minimize directional bias and improve pattern recognition. The tutorial includes R code, using packages like terra, sf, and tidyverse, to manipulate the data and visualize the grid, with a focus on a cleaner, clutter-free presentation, and includes data from a 2023 paper for in-depth reference.
Go to Resource
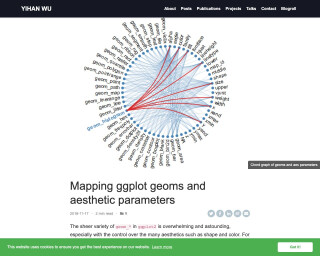
Mapping ggplot geoms and aesthetic properties
A blog post by Yihan Wu about mapping ggplot geoms and aesthetic parameters using the ggplot2 package in R.
Go to Resource