Resources
This carefully curated collection of resources will help you find packages and learning resources to help you on your R journey.

Join Data with dplyr in R (9 Examples) | inner, left, righ, full, semi & anti
This tutorial provides examples and explanations of how to join and merge data frames in R using the dplyr package. It covers inner_join, left_join, right_join, full_join, semi_join, and anti_join functions.
Go to Resource

Jonathan Kitt - #TidyTuesday 2023 - Week 31
This is a tutorial on how to participate in the #TidyTuesday weekly challenge, organized by the R4DS Online Learning Community. The tutorial covers loading packages, downloading the dataset, cleaning the data, and creating visualizations.
Go to Resource
June Choe: Setting up and debugging custom fonts
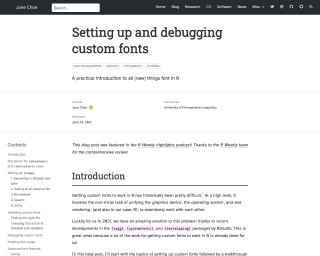
This blog post provides a practical introduction to setting up and debugging custom fonts in R for data visualization using the {ragg}, {systemfonts}, and {textshaping} packages. It covers topics such as installing custom fonts, checking font availability, and advanced font features. The post also includes use-case examples and tips for using custom fonts in different R environments like RStudio, Rmarkdown, and Shiny.
Go to Resource


Keep your packages up-to-date with minimal hassle
{updateme} is an R package that enhances the library() function by displaying informative messages about the current status of loaded packages with respect to their latest versions. It supports packages installed from CRAN, Bioconductor, GitHub, and GitLab. The tool provides configurations for checking updates and can be easily integrated into the R startup process. The package also features caching mechanisms to improve performance and can be toggled on or off as needed. It's designed to help R users keep their packages up-to-date with minimal hassle.
Go to Resource
LA County Population Data Viz
This content outlines a detailed example of accessing and visualizing population data for Los Angeles County using R programming language. It provides insights into the population size of LA County compared to the city proper and the greater metropolitan area. Additionally, the text includes R code that interacts with the U.S. Census Bureau API, demonstrating how to retrieve, filter, and arrange population estimates with county-level granularity and geometry data for mapping. The snippet focuses on data manipulation and visualization techniques using tidyverse and tidycensus, highlighting the practical application of these tools in demographic analysis.
Go to Resource
labelled
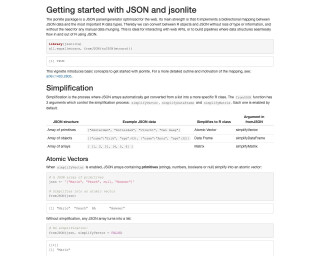
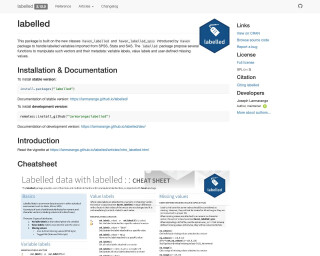
Manipulating Labelled Data is a package in R that provides functions for handling labelled variables imported from SPSS, Stata, and SAS. It allows for manipulation of variable labels, value labels, and user-defined missing values.
Go to Resource
Large Language Model tools for R
This guide, written by Luis D. Verde Arregoitia and published on February 16, 2026, focuses on Large Language Model (LLM) tools specifically designed for usage with the R programming language. It provides an updated roundup of various tools and developments in the LLM and genAI space, including new R packages like interactive code review, predictive modeling assistant, AI coding agent CLI, prompt-building framework with validation, automated data analysis architecture, and native R interfaces to Hugging Face models and datasets. Other tools like a CLI extension with IDE integration are also mentioned. The guide aims to facilitate users, especially those in R communities, by tracking and summarizing the latest useful resources.
Go to Resource
Large Language Model tools for R
This guide serves as a roundup of Large Language Model (LLM) and general AI tools specifically for R users, written by Luis D. Verde Arregoitia. It includes the latest developments in the LLM/genAI space as of June 2025, with resources such as chatting with OpenAI models within RStudio using PacketLLM, model context protocol with mcpr, and image generation with diffuseR. The content is designed for teaching and tracking updates in LLM+R tools. It is presented in an easy-to-navigate book format, which will be periodically updated to reflect changes in the fast-moving field.
Go to Resource
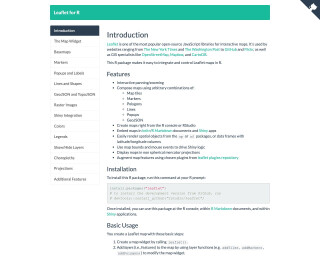
leaflet
Leaflet for R is an R package that makes it easy to integrate and control Leaflet maps in R. It provides interactive panning/zooming, the ability to compose maps using various map elements, and integration with Shiny apps. The package allows users to create maps from the R console or RStudio, embed maps in knitr/R Markdown documents and Shiny apps, and render spatial objects from the sp or sf packages. The package is widely used by websites, GIS specialists, and data visualization professionals.
Go to Resource