
Resources
This carefully curated collection of resources will help you find packages and learning resources to help you on your R journey.

How to Make Slides in R Using xaringan
A tutorial on how to make slides in R using xaringan
Go to Resource
How to make your data analysis life easier using Positron, Raycast, and Espanso
Andrew Heiss discusses the Positron settings and tools he leverages to streamline his data analysis workflow. He shares a highlight of his favorite Positron extensions, such as Air, Better Comments, and Rainbow CSV, and delves into his custom settings for Positron, including editor preferences like font and whitespace handling, version control with Git signing, and various settings to improve the user interface and functionality. Andrew's tips aim to help others in the data science field optimize their setup for efficiency and ease of use.
Go to Resource
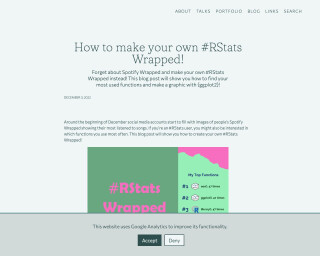
How to make your own #RStats Wrapped! | Nicola Rennie
This blog post provides a tutorial on how to create your own #RStats Wrapped, showing your most used functions and creating a graphic with ggplot2.
Go to Resource
How to open a folder as a Positron project with macOS Quick Actions
Andrew Heiss provides a macOS Quick Action workflow for opening folders as projects in Positron directly from Finder. He details the challenges of transitioning from RStudio's Rproj files to Positron, which lacks an equivalent. To improve efficiency, Heiss introduces an 'Open in Positron' Quick Action and explains the concept of Positron workspaces. He compares them to Rproj files and discusses their pros and cons, offering insights into project-oriented workflows for Positron. Additional details include the integration of project switcher menus, recent project lists, and multi-root workspaces in Positron.
Go to Resource
How to open files, folders, websites in R
Maëlle's R Blog post discusses best practices for using R functions and tools to open files, folders, and websites efficiently. It emphasizes streamlining the process to quickly begin work on projects. The post describes functions like utils::file.edit(), usethis::use_r(), and usethis::use_test(), and suggests keyboard-based workflows in RStudio IDE and Positron to navigate projects effectively. It acknowledges inputs and reviews from Hannah Frick and discusses using the command line and configuring PATH for project launching.
Go to Resource
How to Recreate this NY Times Chart in R
Spencer Schien walks through the process of recreating a professional New York Times chart using R. This type of tutorial is invaluable for learning advanced data visualization techniques by studying and replicating the work of professional data journalists with ggplot.
Go to Resource
How to Split Data into Equal Sized Groups in R: A Comprehensive Guide for Beginners
This guide instructs beginners on splitting data into equal-sized groups in R, essential for cross-validation and balanced datasets. Using the split() function, cut_number() from ggplot2, and group_split() from dplyr, it provides syntax and examples for various data types. Detailed explanations and practical examples aid in mastering data manipulation for model evaluation and analysis.
Go to Resource
How to Turn Messy PDFs into Clean Data Frames with R and Elmer
Albert Rapp demonstrates how to use the {ellmer} package to leverage AI models for extracting data from messy PDF files. If you’ve ever struggled with getting clean data out of PDFs, you know how challenging this task can be. This tutorial shows how AI can streamline this traditionally painful process, making it much easier to transform unstructured PDF content into usable data frames in R.
Go to Resource
How to use a histogram as a legend in {ggplot2}
Andrew Heiss demonstrates how to create choropleth maps in 'ggplot2' with an integrated histogram as a legend to provide additional context for the data. This approach helps to counter visual bias, such as large areas with similar colors obscuring the true distribution of data. Heiss highlights the issue using unemployment rates across U.S. counties, where larger counties can appear to have a disproportionate impact. To address this, he uses the 'ggplot2' and 'patchwork' packages in R, offering a programmatic solution as opposed to the manual process of using D3, Excel, and Figma outlined in Joey Cherdarchuk's original post.
Go to Resource
How to use R to dig for story ideas
The tutorial details the use of R for data journalism, particularly for investigating datasets to uncover story ideas. Highlighted at the Investigative Reporters and Editors conference by Charles Minshew, it emphasizes using R scripts, Tidyverse, and readxl packages to explore a dataset of Boston government employee earnings. By questioning datasets with basic R code, journalists can extract information such as salary attributes, department sizes, and common job titles. It also suggests using descriptive statistics to identify leads for stories, like discovering high earners within the data.
Go to Resource

How to write an R package
R packages are great for organizing your own work and sharing with others. This article provides a step-by-step guide on how to write an R package using tools like devtools, usethis, and roxygen2.
Go to Resource
How to write your own R package and publish it on CRAN
A tutorial on how to write your own R package and publish it on CRAN
Go to Resource