
Resources
This carefully curated collection of resources will help you find packages and learning resources to help you on your R journey.
How (and Why) I came to Use R for Data Analysis and Evaluation
Alberto Espinoza recounts his journey with R for data analysis and evaluation, marking his 10-year experience since first encountering R during his graduate assistantship. Initially clueless about R, he was tasked with assisting and leading statistics labs using R. Despite early challenges and a steep learning curve, he recognized R's power over software like SPSS or Excel. His continued use of R spanned graduate projects, market research, data preparation for Tableau, and Survey Monkey analysis. Espinoza outlines R's advantages: reproducibility, efficiency, clarity, and an extensive package ecosystem, underlining R's significance in his professional growth.
Go to Resource
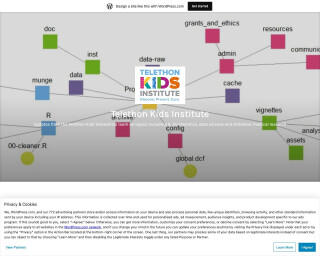
How Do You Organise Your R Project? This Is What We Do.
This blog post discusses how the Biometrics group at Telethon Kids Institute organizes their R projects using a standardized template project directory. The post covers the project directory structure, reproducible research practices, and the use of version control.
Go to Resource
How I’m using Claude Code to write R code
Simon P. Couch discusses his experiences using Claude Code to write R code, including initial impressions, subsequent reduced usage, and recent enhancements leading to more effective use. He highlights the importance of providing the model with adequate context to understand the project, through techniques such as creating a CLAUDE.md file with instructions and project-specific information. Couch details how incorporating the Model Context Protocol, slash commands, and external documentation improved his workflow. By facilitating model access to R package documentation and setting up an MCP server, he can now use Claude Code more efficiently for coding assistance.
Go to Resource
How Major League Teams use R to Analyze Baseball Data
Keith Woolner, on September 27, 2023, delivers a presentation showcasing how Major League Baseball teams utilize the R programming language to perform data analysis on baseball statistics. The video, available on YouTube, dives into methodologies and tools used within the industry to crunch numbers and derive insights that can potentially give teams a competitive edge. It touches upon predictive modeling, player performance evaluation, and related statistical techniques, evidencing R's pivotal role in sports analytics and data-driven decision-making in professional baseball.
Go to Resource
How many cars are there in Madison?
Harald Kliems analyzes car ownership in Madison using the American Community Survey data to examine trends over time. His study reveals periods of growth and stagnation in car numbers. By plotting the data, Harald provides a visual representation of these trends in comparison to Seattle. The analysis also includes looking at households in Madison to contextualize the car ownership data, calculating cars per 100 households to understand the implications of city growth on transportation. The article uses R code snippets to demonstrate data extraction, transformation, and visualization.
Go to Resource
How to automatically crop images using R ("autocrop" / "smart crop" tutorial) - YouTube
This tutorial on YouTube demonstrates how to automatically crop images using R. The tutorial focuses on the autocrop or smart crop technique.
Go to Resource
How to Build and Automate Serverless Dashboards with R or Python
Albert Rapp walks through how to build serverless dashboards in R or Python and then automate their deployment using GitHub Actions. The video covers how to set up a dashboard that runs without a server, and then how to configure a GitHub Actions workflow so the dashboard redeploys automatically whenever you push changes to your repository. It’s a practical guide for anyone who wants to get a Quarto dashboard online without the overhead of managing a server—and without having to remember to redeploy manually every time something changes.
Go to Resource
How to create CUSTOM Callout Boxes in Quarto - YouTube
This video tutorial demonstrates how to create custom callout boxes in Quarto, a document authoring system in R. Quarto allows you to customize your callout boxes to make your documents visually appealing and informative.
Go to Resource
How to fill maps with density gradients with R, {ggplot2}, and {sf} | Andrew Heiss
The blog post by Andrew Heiss explains how to address overplotting in geographic maps created with R, {ggplot2}, and {sf}. A student's project sparked the investigation into making maps more readable by filling areas with a gradient based on event count, rather than using many individual points. The post assumes familiarity with R and the {tidyverse}, and touches on various strategies for fixing overplotting, including transparency, point resizing, and density contour plotting. The author provides code examples, discusses the unique challenges of mapping, and offers solutions for visually coherent geographic data representation.
Go to Resource
How to fill maps with density gradients with R, {ggplot2}, and {sf} | Andrew Heiss
Learn how to fill maps with density gradients using R, ggplot2, and sf.
Go to Resource
How to Get Good with R? | Credibly Curious
This blog post discusses tips and strategies for improving coding skills in R, as well as non-coding aspects like community involvement and continuous learning.
Go to Resource
How to Make Functions in R
This article provides a tutorial on how to make functions in R, with a focus on creating user-defined functions. It discusses the benefits of using functions and provides an example of creating a function to generate a table of the largest schools in different states using a dataset on school enrollment. The article also mentions the author's custom training services for organizations looking to transition to R and improve their programming efficiency.
Go to Resource