
Resources
This carefully curated collection of resources will help you find packages and learning resources to help you on your R journey.
gtExtras
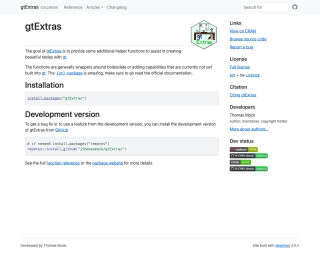
gtExtras is an R package that provides additional helper functions to assist in creating beautiful tables with the gt package.
Go to Resource
gtUtils
gtUtils is an R package designed to augment the capabilities of the 'gt' package, which is used for constructing eye-catching tables in R. It offers a range of themes, color functions, and additional utilities to make the tables more appealing and functional. The package includes features such as border bars and tools to create tier lists. Users can install it from GitHub and get started by consulting the provided vignettes, which include instructions for general use, applying table themes, and more. For further insights and examples, the author also encourages visiting their blog.
Go to Resource
Hadley Wickham @ Posit | Giving benefit to people using what you build | Data Science Hangout - YouTube
A Data Science Hangout interview with Hadley Wickham, discussing the philosophy of giving benefit to people using the tools he builds.
Go to Resource

Happy 18th birthday ggplot2!
This content celebrates the 18th birthday of the data visualization package ggplot2, created by Hadley Wickham. It illustrates the significance and widespread appreciation of ggplot2 within the data science community through comments and reactions from various users. Comments highlight how ggplot2 has revolutionized the creation of data plots in R, and the playful puns acknowledge the package's 'maturity' with references to drinking age and bar charts. The community expresses gratitude towards Wickham and his team for their contributions to the R ecosystem.
Go to Resource

Happy Git with R
Happy Git and GitHub for the useR provides instructions on how to install and use Git and GitHub with R and R Markdown. It covers key workflows and demonstrates the synergy between R/R Markdown/RStudio and GitHub. The target audience includes those who use R for data analysis or work on R packages.
Go to Resource

Helpers for Automatic Translation of Markdown-based Content • babeldown
babeldown is an R package designed for automatically translating Markdown-based R content with the help of the DeepL API. It facilitates the translation of Markdown strings, files, Quarto book chapters, and Hugo blog posts. The package offers a straightforward installation process through rOpenSci R-universe or GitHub. It supports the free and Pro plans of the DeepL API, requiring configuration of the API URL and key. Features like recommended line-wrapping practices and troubleshooting tips for common issues, such as punctuation mix-ups and API credit exhaustion, are provided. RStudio users can also benefit from integrated features.
Go to Resource
Helpers for Automatic Translation of Markdown-based Content • babeldown
Helpers for Automatic Translation of Markdown-based Content
Go to Resource
Hillshade effects
Dr. Dominic Royé's blog post on hillshade effects explains creating relief maps in R with shadow effects to generate visual depth. He uses several R packages, including 'sf' for vector data, 'elevatr' for elevation API access, 'terra' for raster manipulation, 'whitebox' for geospatial analysis, and 'ggplot2' extensions for scales and color blending. The tutorial covers installing packages, importing and filtering lake boundaries, and manipulating Digital Elevation Models (DEMs) for Switzerland, with reproducible R code snippets.
Go to Resource
Homelessness and Rents in Canada
This content is a comprehensive R code walkthrough for analyzing homelessness and rent data in Canada. It uses multiple R libraries, including the tidyverse for data wrangling, can census for accessing census data, and patchwork for visualizing data. Important steps include data import, cleaning, and transforming with functions like mutate, filter, and summarize. Quantile calculations for rents and adjustments for CPI are shown to assess real rents over time. It highlights metros like Vancouver and Toronto, using colors to represent different years. The code indicates a rich, data-driven analysis and visualization process focusing on socio-economic issues of homelessness and rents.
Go to Resource