
Resources
This carefully curated collection of resources will help you find packages and learning resources to help you on your R journey.
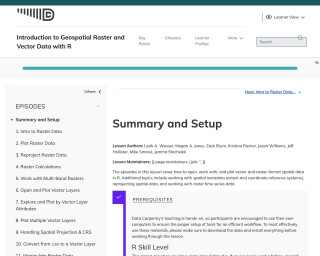
Introduction to Geospatial Raster and Vector Data with R
This lesson covers how to open, work with, and plot vector and raster-format spatial data in R. It also includes topics such as working with spatial metadata, reprojecting spatial data, and working with raster time series data.
Go to Resource
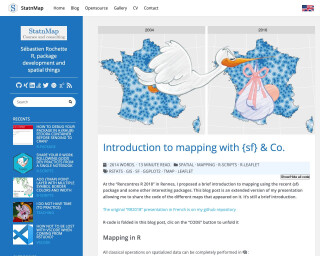
Introduction to mapping with {sf} & Co.
This blog post is an extended version of a presentation on mapping using the {sf} package and other related packages in R. It covers topics such as reading and exploring spatial data, manipulating attributes, geomatics processing, and creating static and interactive maps. The post also touches on the importance of projections and provides an example of projecting the map of Metropolitan France. The code for the different maps presented in the post is included.
Go to Resource

Introduction to Open Data Science: GitHub
This chapter covers the topic of using GitHub for collaboration in open data science projects. It includes objectives and resources for learning about Git and GitHub, setting up Git & GitHub, creating and cloning repositories, syncing files between local and remote repositories, exploring remote GitHub, and collaborating with GitHub.
Go to Resource
Introduction to typstable
typstable is an R package designed to create publication-ready tables specifically for Quarto documents utilizing the Typst typesetting system, an alternative to LaTeX. It offers functions to establish basic tables, format cells, rows, columns, and apply various styling options including striped layouts, color fills, and custom column widths. It also supports spanning headers across multiple columns and grouping rows. The package's functions like tt(), tt_column(), tt_row(), use tidyselect syntax for targeting, combined with a fluent interface allowing seamless chaining of table modifications, making table production both efficient and customizable for high-quality document rendering.
Go to Resource

Introduction to web scraping
Stein Arne Brekke provides an introductory guide to web scraping judicial data in R, focusing on creating a dataset from UK Supreme Court decisions. Emphasizing empirical legal studies, the guide covers data gathering from online sources through programming. It offers a step-by-step process for scraping and organizing data into usable tables for research, using R. Beginners are pointed to additional learning resources, and the guide includes sections on scraping, data management, analysis, and legal considerations. It encourages sharing collected data to aid comparative legal research.
Go to Resource
Iterate parameterised {xaringan} reports
Learn how to iterate parameterised xaringan reports using R. This tutorial demonstrates how to create a parameterised R Markdown template and iterate over parameter values to generate multiple reports with different data.
Go to Resource
Iterated fact sheets with R Markdown
This article explains how to use R Markdown to create iterated fact sheets. It provides an overview of R Markdown, discusses the necessary ingredients for creating multiple fact sheets, and provides examples using the bad_drivers dataset.
Go to Resource
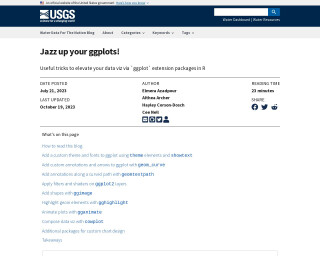
Jazz up your ggplots!
This blog post from USGS VizLab outlines various methods to customize data visualizations using ggplot2 and its extension packages in R. It discusses enhancing plots with custom themes, fonts, annotations, effects, shapes, highlights, and animations. The authors provide comprehensive code examples for each technique, encouraging reproducibility and the use of ggplot2 ecosystem rather than external design software. The blog also features a guide on how to read it effectively, including executing data-wrangling steps, installing necessary packages, and incorporating showtext for fonts.
Go to Resource
Jazz up your ggplots! | Water Data For The Nation Blog
This blog post provides useful tricks and examples to customize ggplot2 visualizations in R using extension packages. It covers topics like adding custom themes and fonts, annotations and arrows, filters and shaders, shapes and image, highlighting elements, plot animation, chart composition, and additional packages for custom chart design.
Go to Resource
Jazz up your ggplots! | Water Data For The Nation Blog
Useful tricks to elevate your data visualization with ggplot extension packages in R.
Go to Resource
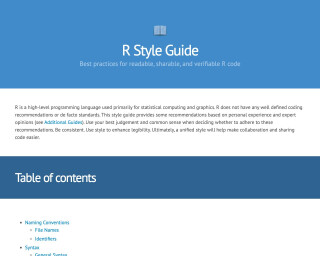
JEFworks Lab style guide
Best practices for readable, sharable, and verifiable R code
Go to Resource