
Making Beautiful Tables with R
Change cell properties
This lesson is called Change cell properties, part of the Making Beautiful Tables with R course. This lesson is called Change cell properties, part of the Making Beautiful Tables with R course.
Transcript
Click on the transcript to go to that point in the video. Please note that transcripts are auto generated and may contain minor inaccuracies.
Loading transcript...
We'll use border(), line_spacing(), fp_cell() and fp_border().
final_table <- bind_rows(penguin_counts_wider, maximum_summary, total_summary) |>
  arrange(island, year) |>
  mutate(island = paste('Island: ', island)) |>
  as_grouped_data(groups = 'island') |>
  as_flextable(hide_grouplabel = TRUE) |>
  set_header_labels(
    island = 'Island',
    year = '',
    Adelie_female = 'Female',
    Adelie_male = 'Male',
    Chinstrap_female = 'Female',
    Chinstrap_male = 'Male',
    Gentoo_female = 'Female',
    Gentoo_male = 'Male'
  ) |>
  add_header_row(
    values = c('', 'Adelie', 'Chinstrap', 'Gentoo'),
    colwidths = c(1, 2, 2, 2)
  ) |>
  add_header_lines(
    values = c('Penguins in the Palmer Archipelago', 'Data is courtesy of the {palmerpenguins} R package')
  ) |>
  align(i = 3, align = 'center', part = 'header') |>
  colformat_num(i = ~ (is.na(island)), na_str = '-') |>
  align(
    i = ~ (year %in% 2007:2009),
    j = 'year',
    align = 'right'
  ) |>
  hline(i = ~ (!is.na(island) | year %in% c('2009', 'Total')), border = fp_border(width = 1, color = 'grey40')) |>
  bg(i = 3:4, bg = 'dodgerblue4', part = 'header') |>
  bg(i = ~ (year %in% seq(2007, 2009, 2)), bg = 'grey90') |>
  bold(part = 'header', i = 3) |>
  color(i = 3:4, part = 'header', color = 'white') |>
  border(j = 'year', border.right = fp_border(color = 'grey40', width = 1)) |>
  style( #### subtitle
    part = 'header',
    i = 2,
    pr_t = fp_text(font.size = 11),
    ### This part is added
    pr_c = fp_cell(border = fp_border(width = 0, color = 'grey40'))
  ) |>
  style( ### title
    part = 'header',
    i = 1,
    pr_t = fp_text(
      color = 'dodgerblue4',
      font.size = 18,
      font.family = 'Merriweather',
      bold = TRUE
    ),
    ### This part is added
    pr_c = fp_cell(
      border.top = fp_border(width = 1.5, color = 'grey40'),
      border.bottom = fp_border(width = 0, color = 'grey40')
    )
  ) |>
  style( ### group rows
    i = ~ (!is.na(island)),
    ### This part is added
    pr_c = fp_cell(
      border.top = fp_border(width = 1, color = 'grey40'),
      border.bottom = fp_border(width = 1, color = 'grey40'),
      border.right = fp_border(width = 0, color = 'grey40')
    ),
    pr_t = fp_text(
      color = 'dodgerblue4',
      bold = TRUE,
      font.size = 12,
    )
  ) |>
  line_spacing(part= 'all', space = 0.9) |>
  ### This part is added
  hline(part = 'header', i = 2, border = fp_border(width = 0)) |>
  hline(part = 'header', i = 3, border = fp_border(width = 0)) |>
  autofit()
final_tableYour Turn
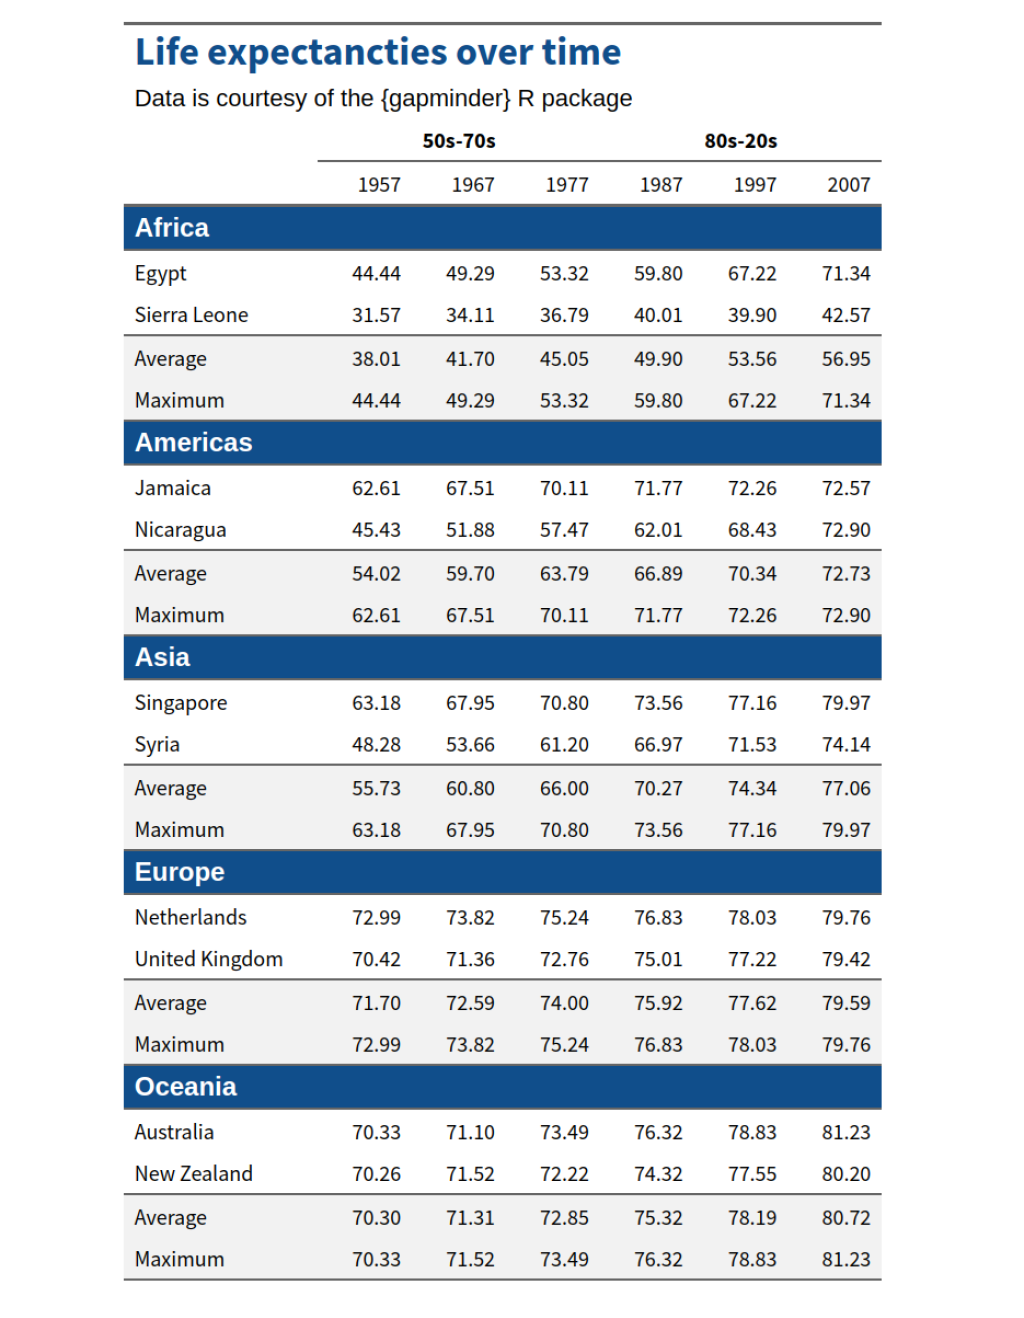
Remove the borders around the subtitle
Remove the top border on the group labels (“50s-70s”)
Make the bottom border below the group labels (“50s-70s”) into a thin line that does not include the country column
Set the line spacing everywhere to
0.75
Your table should look like this:
Have any questions? Put them below and we will help you out!
Course Content
16 Lessons
You need to be signed-in to comment on this post. Login.