
Making Beautiful Tables with R
Use groups instead of repetitive columns
This lesson is called Use groups instead of repetitive columns, part of the Making Beautiful Tables with R course. This lesson is called Use groups instead of repetitive columns, part of the Making Beautiful Tables with R course.
Transcript
Click on the transcript to go to that point in the video. Please note that transcripts are auto generated and may contain minor inaccuracies.
Loading transcript...
It’s better to use groups instead of repetitive columns. For instance, the island column repeats itself multiple times before we move on to the next island name. This is a doesn’t really look good. And it would be nice if we can just make it visually clearer that certain rows belong to certain islands.
The way to do that is to use groups. This means that we have rows (one for each island) that spans all of the columns. Here, we’ll transition to as_flextable() because I like hide_grouplabel. But I’ll show the flextable() version before that.
penguin_counts_wider |>
  mutate(island = paste('Island: ', island)) |>
  as_grouped_data(
    groups = 'island'
  ) |>
  as_flextable(hide_grouplabel = TRUE) |>
  set_header_labels(
    island = 'Island',
    year = '',
    Adelie_female = 'Female',
    Adelie_male = 'Male',
    Chinstrap_female = 'Female',
    Chinstrap_male = 'Male',
    Gentoo_female = 'Female',
    Gentoo_male = 'Male'
  ) |>
  add_header_row(
    values = c('', 'Adelie', 'Chinstrap', 'Gentoo'),
    colwidths = c(1, 2, 2, 2)
  ) |>
  add_header_lines(
    values = c('Penguins in the Palmer Archipelago', 'Data is courtesy of the {palmerpenguins} R package')
  ) |>
  align(i = 3, align = 'center', part = 'header') |>
autofit()Your Turn
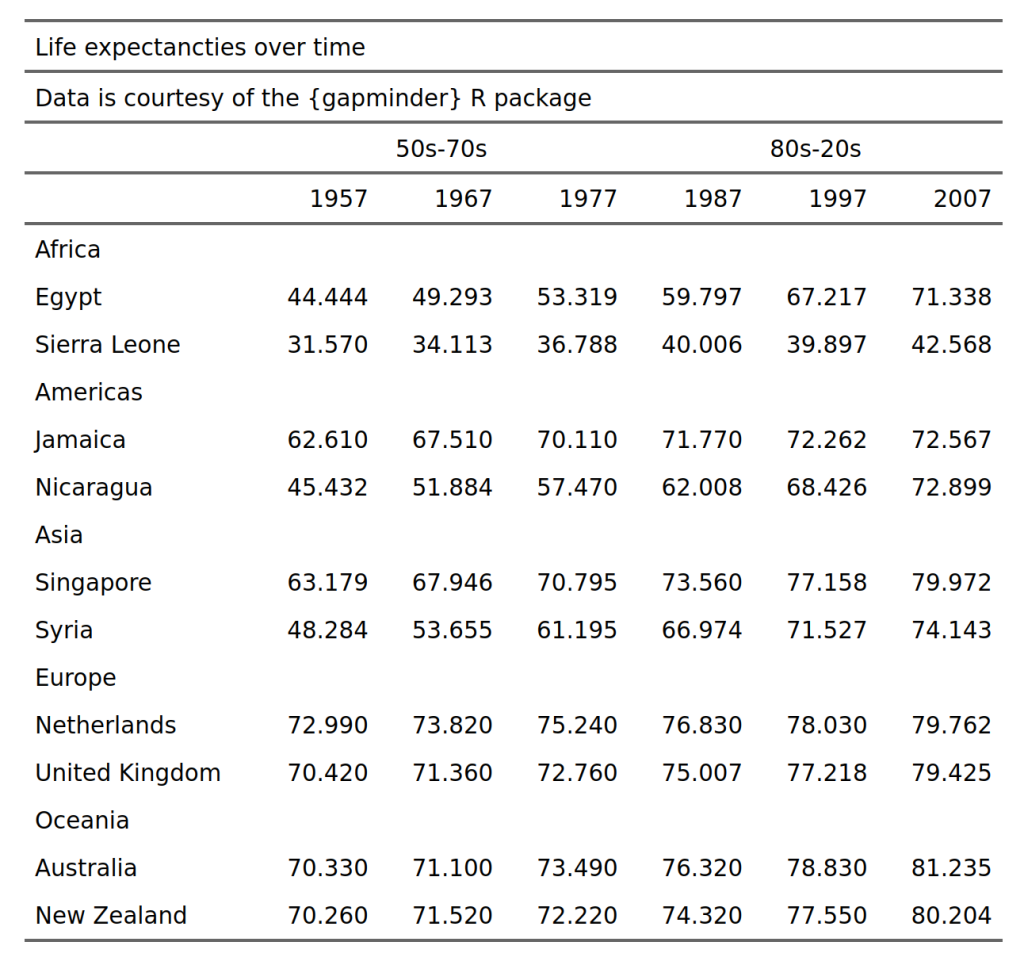
Group your table by continent. Using hide_grouplabel = TRUE in as_flextable() may be helpful. At the end, your table should look like this:
Have any questions? Put them below and we will help you out!
Course Content
16 Lessons
You need to be signed-in to comment on this post. Login.